
Home size in England
England · 2024 dwelling stock
The average home tells only part of the story. England’s mean floor area was 96 m² in the 2024 stock estimates, but the share of smaller homes differs sharply between tenures. Here is the distribution behind that average, calculated from the English Housing Survey.
By The Room Study · Published
Data: 2024 dwelling stock · Sources checked 26 September 2026
Key findings
The mean floor area of dwellings in England was 96 m² in the English Housing Survey’s 2024 stock estimates. Source
Link to findingAn estimated 18.1% of England’s owner occupied dwelling stock was below 70 m² in 2024. Source
Link to findingAn estimated 49.1% of England’s private rented dwelling stock was below 70 m² in 2024. Source
Link to findingAn estimated 30.8% of all dwellings in England were below 70 m² in the 2024 stock estimates. Source
Link to finding
What is the average size of a home in England?
The mean was 96 m² across England’s occupied and vacant dwellings in the 2024 English Housing Survey stock estimates. The figure includes houses and flats. It is not a UK-wide estimate.
A mean adds up the floor area and divides it by the number of dwellings. It does not tell us the size of the middle home, and larger properties can pull it upwards. Read it alongside the distribution below.
How many homes are below 70 m²?
The Room Study calculates that 30.8% of England’s dwellings were below 70 m². Within the owner-occupied sector the share was 18.1%, compared with 49.1% in private renting and 59.2% in social renting.
These are shares within each tenure. They do not say that 59.2% of all small homes are socially rented. Vacant homes remain in the dwelling-stock estimates, classified by tenure.
Homes below 70 m², by tenure
Share of dwellings in England, 2024 (%)

The Room Study calculations from English Housing Survey table 1.6. Method and limits
Download chart (SVG)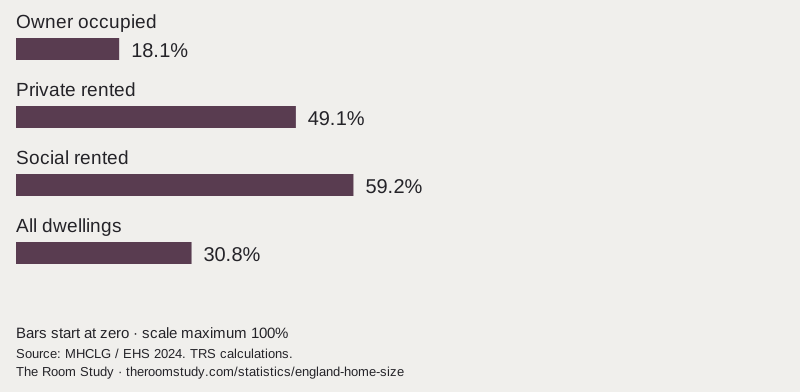
| Tenure | Below 70 m² | Mean floor area |
|---|---|---|
| Owner occupied | 18.1% | 110 m² |
| Private rented | 49.1% | 76 m² |
| Social rented | 59.2% | 66 m² |
| All dwellings | 30.8% | 96 m² |
What does this tell us about designing a smaller home?
A national average is a poor starting point for deciding whether a sofa will fit. Door swings, routes through the room and usable wall lengths still need measuring. The figures do show why advice based on generous floor plans can miss the circumstances of many renters.
The 70 m² threshold is a published survey-band boundary we have combined for this analysis. It is not a minimum space standard, an overcrowding test or a judgement about how well a home works.
Can this be called the average UK house size?
No. This source covers England, includes flats and measures the whole dwelling. It cannot supply a UK-wide average or the dimensions of a typical living room. Scotland, Wales and Northern Ireland need their own compatible evidence before any UK estimate could be assembled.
Methodology & sources
We combined the “less than 50 m²” and “50 to 69 m²” weighted dwelling counts in annex table 1.6, then divided by all dwellings in the same tenure. The download preserves the inputs in thousands and the formula. Percentages are rounded to one decimal; means are rounded to whole square metres.
The physical survey covers March 2023 to March 2025 and is reported at its 2024 midpoint. Its 14,919 inspected dwellings include vacant properties. Do not mix these denominators with the separate 2024 to 2025 household interview sample.
These are survey estimates. Our tenure comparisons are descriptive, with no new significance test or claim that tenure itself causes a difference in home size. We have not estimated a median from grouped bands.
We review these resources when the underlying releases change. A review date does not make a figure expire: its measurement period stays visible until a checked revision replaces it.
English Housing Survey 2024 to 2025: annex table 1.6
- Publisher
- Ministry of Housing, Communities & Local Government
- Release
- 2025-12-04. Chapter updated 9 July 2026; source file checked 26 September 2026.
- Coverage
- England. Occupied and vacant dwellings, classified by tenure. 2024 dwelling stock; physical fieldwork March 2023 to March 2025.
- Method
- Weighted physical survey. The stock reference year is the midpoint of two fieldwork years. Household interview tables have a different population. 14,919 physical inspections across the two survey years.
- Reuse
- Crown copyright, Open Government Licence v3.0 except identified third-party material. Source reuse information
Cite this research
Credit the original source when using its estimates. For our derived comparisons, credit The Room Study analysis and retain the population and dates.
The Room Study (2026). Home size in England. Published 26 September 2026. https://theroomstudy.com/statistics/england-home-size. Based on Ministry of Housing, Communities & Local Government data; measurement period: 2024 dwelling stock.
CSV: source estimates and The Room Study calculations. Please keep the source attribution and methodological notes with any reuse.