
The changing size of new American homes
United States · 1973 to 2025
New American homes are smaller than they were a decade ago, although they remain larger than the homes completed in the early 1970s. The Census series puts both changes in view. It measures new single-family houses completed each year, not the entire housing stock.
By The Room Study · Published
Data: 1973 to 2025 · Sources checked 26 September 2026
Key findings
The median floor area of newly completed U.S. single-family houses was 2,142 sq ft in 2025. Source
Link to findingThe mean floor area of newly completed U.S. single-family houses was 2,378 sq ft in 2025. Source
Link to findingThe Room Study analysis of Census estimates finds the 2025 median for newly completed U.S. single-family houses was 13.2% below the 2015 median. Source
Link to findingThe 2025 median for newly completed U.S. single-family houses was 40.5% above the 1973 estimate. Source
Link to finding
How large was a newly completed home in 2025?
The median was 2,142 sq ft and the mean was 2,378 sq ft for newly completed U.S. single-family houses. The median is the middle of the estimated size distribution; the mean is the arithmetic average.
Single-family includes qualifying townhouses and other attached houses, as well as detached homes. This series excludes multifamily units, so it should not be used as the average size of every American home.
How much has new-home size changed?
The Room Study calculates that the 2025 median was 13.2% below the 2015 estimate of 2,467 sq ft. Against the 1973 estimate of 1,525 sq ft, it was 40.5% higher.
The starting year changes the story. These comparisons describe the mix of homes completed in each year; they do not track individual houses getting smaller or establish why builders changed what they built.
New homes: a longer view
Median floor area, newly completed U.S. single-family houses (sq ft)

Source: U.S. Census Bureau, Characteristics of New Housing. Point estimates, not confidence intervals. Method and limits
Download chart (SVG)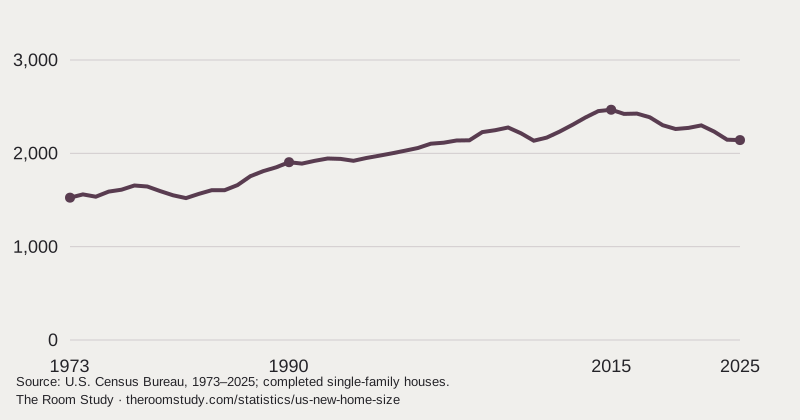
| Geography | Median (sq ft) | Mean (sq ft) | Median change since 2015 |
|---|---|---|---|
| United States | 2,142 | 2,378 | -13.2% |
| Northeast | 2,459 | 2,644 | -1.3% |
| Midwest | 1,969 | 2,240 | -15.1% |
| South | 2,162 | 2,396 | -14.1% |
| West | 2,090 | 2,336 | -14.2% |
View every year in the chart (1973 to 2025)
| Year | Median (sq ft) |
|---|---|
| 1973 | 1,525 |
| 1974 | 1,560 |
| 1975 | 1,535 |
| 1976 | 1,590 |
| 1977 | 1,610 |
| 1978 | 1,655 |
| 1979 | 1,645 |
| 1980 | 1,595 |
| 1981 | 1,550 |
| 1982 | 1,520 |
| 1983 | 1,565 |
| 1984 | 1,605 |
| 1985 | 1,605 |
| 1986 | 1,660 |
| 1987 | 1,755 |
| 1988 | 1,810 |
| 1989 | 1,850 |
| 1990 | 1,905 |
| 1991 | 1,890 |
| 1992 | 1,920 |
| 1993 | 1,945 |
| 1994 | 1,940 |
| 1995 | 1,920 |
| 1996 | 1,950 |
| 1997 | 1,975 |
| 1998 | 2,000 |
| 1999 | 2,028 |
| 2000 | 2,057 |
| 2001 | 2,103 |
| 2002 | 2,114 |
| 2003 | 2,137 |
| 2004 | 2,140 |
| 2005 | 2,227 |
| 2006 | 2,248 |
| 2007 | 2,277 |
| 2008 | 2,215 |
| 2009 | 2,135 |
| 2010 | 2,169 |
| 2011 | 2,233 |
| 2012 | 2,306 |
| 2013 | 2,384 |
| 2014 | 2,453 |
| 2015 | 2,467 |
| 2016 | 2,422 |
| 2017 | 2,426 |
| 2018 | 2,386 |
| 2019 | 2,301 |
| 2020 | 2,261 |
| 2021 | 2,273 |
| 2022 | 2,299 |
| 2023 | 2,233 |
| 2024 | 2,146 |
| 2025 | 2,142 |
How do the Census regions compare?
In 2025 the Northeast had the highest published regional median, at 2,459 sq ft; the Midwest had the lowest, at 1,969 sq ft. The South’s estimate was 2,162 sq ft and the West’s was 2,090 sq ft.
Regional medians describe large groups of newly completed homes. They cannot tell you the size of the typical existing home in a particular state or city. The regional changes in the download use each region’s own 2015 baseline.
What counts as floor area?
Census counts finished floor space, including finished basements and attics, on an exterior-dimensions basis. Garages, porches and unfinished areas are excluded. This definition matters when comparing the series with an internal-floor-area measure from another country.
Our England page covers the existing dwelling stock, including flats. Dividing one headline figure by the other would combine different populations and measurement conventions; we have not presented that ratio as a UK–U.S. comparison.
Methodology & sources
Source: Census Characteristics of New Housing, SFTotalMedAvgSqFt worksheet, annual completed-house series. We retain 53 years and five geographies, or 265 rows. The 2025 annual release was published on July 1, 2026.
Percentage change = (comparison-year median − baseline-year median) / baseline-year median × 100. Published estimates are inputs; we do not reconstruct medians from individual homes. Displayed changes use one decimal; the CSV retains three.
The 2025 national median has a published relative standard error of 2%. We have not tested changes for statistical significance. Estimates before 1999 were rounded to the nearest five square feet; the source can revise past years.
The CSV supplies point estimates rather than confidence intervals. Consult the original workbook for the published sampling-error information before testing differences.
We review these resources when the underlying releases change. A review date does not make a figure expire: its measurement period stays visible until a checked revision replaces it.
Characteristics of New Housing: square feet of floor area, single-family houses completed
- Publisher
- U.S. Census Bureau
- Release
- 2026-07-01. 2025 annual release; downloaded series checked 26 September 2026.
- Coverage
- United States and four Census regions. New privately owned single-family houses completed. Annual estimates, 1973 to 2025.
- Method
- Annual sample survey estimates. Single-family includes qualifying attached houses. Floor area is finished space measured on an exterior-dimensions basis, including finished basements and attics; unfinished areas, garages and porches are excluded. Survey of Construction sample; annual realized sample size is not stated in the size table..
- Reuse
- U.S. federal statistical data. Census source acknowledged; no endorsement implied. Source reuse information
Release and current tables · Definitions · Survey methodology
Cite this research
Credit the original source when using its estimates. For our derived comparisons, credit The Room Study analysis and retain the population and dates.
The Room Study (2026). The changing size of new American homes. Published 26 September 2026. https://theroomstudy.com/statistics/us-new-home-size. Based on U.S. Census Bureau data; measurement period: 1973 to 2025.
CSV: source estimates and The Room Study calculations. Please keep the source attribution and methodological notes with any reuse.