
How much space do Americans have per person?
United States · 2024 primary occupied homes · preliminary
A large house can still feel full. A smaller one may give someone living alone far more space to themselves. EIA’s preliminary 2024 figures put the national average at 782 square feet per household member, with substantial differences by tenure and household size.
By The Room Study · Published
Data: 2024 primary occupied homes · preliminary · Sources checked 26 September 2026
Key findings
EIA reports an average of 782 square feet per household member in primary occupied U.S. homes in 2024. The figures are preliminary. Source
Link to findingThe published average was 909 square feet per household member in owned homes and 489 in rented homes: a descriptive gap of 420 square feet. Source
Link to findingRegional averages ranged from 693 square feet per household member in the West to 859 in the Midwest, a 166-square-foot spread. Source
Link to findingFour-person households averaged 2,099 square feet per home, or 525 square feet per household member, in EIA’s 2024 table. Source
Link to finding
What does “space per person” include?
We use EIA’s published measure, “average square footage per household member.” It shares a home’s total area across the people living there; it does not describe the size of a personal room or the amount of private space each person can use.
The area definition is broad: all basements count, along with finished or heated/cooled attic space and conditioned attached garages. The number therefore differs from a listing’s finished living area and should not be treated as an amount of comfortably usable room space.
The home and the household both matter
The owner/renter difference is large in the published table, but these groups also differ in housing type, household composition and location. The table does not isolate the effect of owning rather than renting.
A one-person household averaged 1,502 square feet per member. A four-person household averaged 525. The four-person home was larger overall, yet its space was shared by more people. Those are two different questions, and both matter when planning furniture, storage and routes through a room.
Average floor area per household member
Primary occupied homes · EIA 2024 preliminary · square feet

Source: EIA, table HC10.9, preliminary March 2026 release. Area includes all basements and some attic/garage space. Method and limits
Download chart (SVG)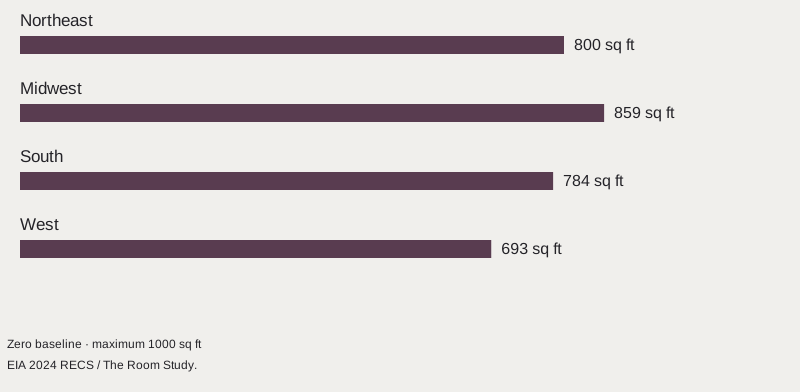
| Group | Sq ft per home | Sq ft per member | Per-member RSE |
|---|---|---|---|
| United States | 1,845 | 782 | 0.70% |
| Northeast | 1,815 | 800 | 1.54% |
| Midwest | 2,003 | 859 | 1.33% |
| South | 1,863 | 784 | 1.22% |
| West | 1,684 | 693 | 1.60% |
| Owned | 2,215 | 909 | 0.91% |
| Rented (including no rent) | 1,075 | 489 | 1.23% |
| One-person household | 1,502 | 1,502 | 1.10% |
| Two-person household | 1,954 | 977 | 0.91% |
| Three-person household | 1,962 | 654 | 1.32% |
| Four-person household | 2,099 | 525 | 1.22% |
| Five-person household | 2,252 | 450 | 2.40% |
| Six or more people | 2,175 | 318 | 2.61% |
An average is not a recommended room size
These figures describe the surveyed housing population. They establish neither a minimum healthy floor area nor an ideal home size. A clear route, enough privacy, usable storage and the arrangement of doors can matter in ways a floor-area total misses.
Nor is the national figure the median experience. It should not be used to say that half of Americans have more space and half have less. We make no international ranking: floor-area definitions and the homes included differ between datasets.
Why keep the official per-member figures?
We checked the public microdata as well as the published table. Its weighted totals and average area per home reproduce the official rounded figures, but a fresh calculation using the public household-member variable does not reproduce the per-member averages.
EIA explains why that variable needs care: household-member counts are derived from age groups capped for disclosure protection. We therefore retain the official HC10.9 per-member estimates and their published relative standard errors. The public file is not used to invent a competing headline or a more detailed regional owner/renter space table.
Methodology & sources
All displayed source estimates and relative standard errors (RSEs) come from EIA table HC10.9, including its RSE pages. Renters include households living without payment of rent. Area is respondent-reported or imputed. Vacant, seasonal and second homes, military housing and group quarters are excluded by the source table’s coverage.
Our two headline differences are simple subtractions of rounded published values: 909 − 489 = 420 square feet for tenure; 859 − 693 = 166 square feet for the regional spread. They were independently reproduced. We do not claim new statistical significance, attribute causation, or average the regional figures to obtain the national estimate.
RSE measures standard error as a percentage of an estimate, not the spread of individual homes. For example, the national per-member RSE of 0.70% implies a standard error of about 5.5 square feet (782 × 0.007), using rounded published inputs. Reporting, imputation and coverage error remain beyond sampling uncertainty.
This page retains the official per-member measure without claiming an exact microdata reconstruction. NHSLDMEM_PUB is derived from capped age-group counts in the public file; substituting it changes the denominator. EIA’s guide documents those caps. For fixed household-size groups, per-home area divided by that group’s size approximates the displayed per-member area, subject to rounding.
The companion new-home-size page covers newly completed single-family houses and uses a different floor-area definition. It is not a like-for-like earlier or later observation of this occupied-home measure. Keep the 2024 measurement year and preliminary status with any citation.
We review these resources when the underlying releases change. A review date does not make a figure expire: its measurement period stays visible until a checked revision replaces it.
2024 RECS table HC10.9: average square footage of U.S. homes
- Publisher
- U.S. Energy Information Administration
- Release
- 2026-03. Preliminary estimates and relative standard errors checked 26 September 2026.
- Coverage
- United States. Housing units occupied as primary residences in the 50 states and District of Columbia. 2024 reference year.
- Method
- Respondent-reported or imputed home area. Total includes all basements, finished or conditioned attics, and conditioned attached garages. Official per-member estimates are retained rather than reconstructed from disclosure-protected household counts. 16,676 responding households, representing approximately 132.5 million primary occupied homes.
- Reuse
- Public-domain U.S. federal statistics, with EIA and release dates acknowledged. No endorsement implied. Source reuse information
Cite this research
Credit the original source when using its estimates. For our derived comparisons, credit The Room Study analysis and retain the population and dates.
The Room Study (2026). How much space do Americans have per person?. Published 26 September 2026. https://theroomstudy.com/statistics/us-home-space-per-person. Based on U.S. Energy Information Administration data; measurement period: 2024 primary occupied homes · preliminary.
CSV: source estimates and The Room Study calculations. Please keep the source attribution and methodological notes with any reuse.