
How many American homes are aging-ready?
United States · 2019 occupied housing stock
Being able to stay at home starts with being able to get through the door and reach a bedroom and bathroom without a flight of stairs. In the Census Bureau’s 2019 survey, 40.4% of occupied homes met that basic combination. The regional picture was far from uniform.
By The Room Study · Published
Data: 2019 occupied housing stock · Sources checked 26 September 2026
Key findings
A step-free entry was reported in 53.6% of occupied U.S. homes in 2019. That feature alone did not make a home aging-ready. Source
Link to findingThe 2019 aging-ready share was 19.6% in New England and 61.6% in West South Central: a descriptive gap of 42.0 percentage points. Source
Link to finding
What does “aging-ready” actually mean?
For this report, a home needs a step-free entrance and both a bedroom and a full bathroom on the first floor. All three must be present. The national share with step-free entry alone, 53.6%, therefore answers a different question.
This definition is a starting point for understanding layout. It does not establish wheelchair turning space, usable door widths, safe bathing arrangements, or whether a particular person can live independently. Passing it is not an accessibility certification.
How does the picture vary across the country?
The table compares occupied homes within each Census division. West South Central includes Arkansas, Louisiana, Oklahoma and Texas; New England includes Connecticut, Maine, Massachusetts, New Hampshire, Rhode Island and Vermont.
Subtracting New England’s 19.6% from West South Central’s 61.6% gives a 42.0-percentage-point gap. This describes the published estimates. It does not mean a randomly chosen home will suit a particular resident, or tell us how much adapting it would cost.
Homes meeting the basic aging-ready definition
Share of occupied homes · nine Census divisions · 2019 (%)

Source: U.S. Census Bureau, 2019 AHS, report P23-219 table 1a. National reference: 40.4%. Method and limits
Download chart (SVG)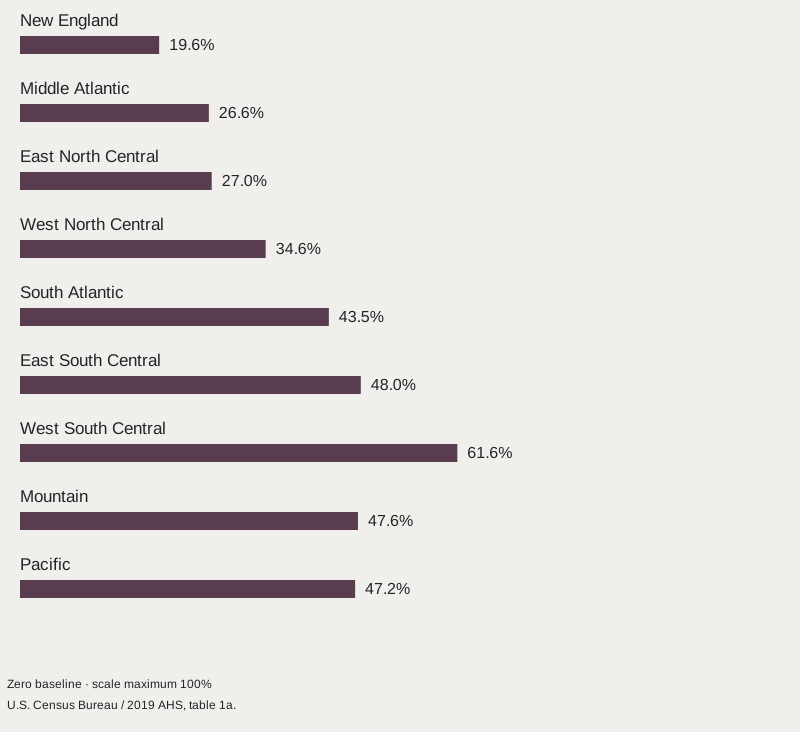
| Geography | Aging-ready share |
|---|---|
| United States | 40.4% |
| New England | 19.6% |
| Middle Atlantic | 26.6% |
| East North Central | 27.0% |
| West North Central | 34.6% |
| South Atlantic | 43.5% |
| East South Central | 48.0% |
| West South Central | 61.6% |
| Mountain | 47.6% |
| Pacific | 47.2% |
Why use a 2019 figure on a page published now?
The report was issued in October 2023, using the 2019 American Housing Survey. The data year belongs with the statistic wherever it is cited. We checked current Census releases, but have not substituted a later housing total for a new measurement of these features.
Do not read this as a 2026 prevalence estimate. Nor should it be plotted as a trend against the earlier 2011 report: the later questionnaire did not retain the same wide-doorway and hallway measure, and Census warns that the estimates are not directly comparable.
What should this change about a room plan?
It gives us three concrete questions to ask before moving furniture: which entrance is usable without steps, where can someone sleep, and where is the full bathroom? Answering them on the plan can expose a problem that a photograph of a beautiful room leaves out.
The next questions depend on the people who live there. A national table cannot replace measurements of a specific home or an assessment of someone’s access needs. It can make those conversations part of the brief from the beginning.
Methodology & sources
The values come from table 1a of Census report P23-219. Its denominator is occupied housing units, not only homes with an older resident and not the entire housing stock including vacant units. The estimates include apartments and mobile homes as well as houses.
The Room Study’s regional gap is 61.6 − 19.6 = 42.0 percentage points, calculated from published one-decimal estimates. It is not a 42% relative difference. We do not average the nine division percentages to obtain a national value; the divisions have different numbers of homes.
The survey records reported features rather than certifying individual buildings. Sampling and response errors remain. Standard errors appear in the source appendix; this page adds no new statistical-significance test, causal explanation or claim of change since 2019.
We review these resources when the underlying releases change. A review date does not make a figure expire: its measurement period stays visible until a checked revision replaces it.
Aging-Ready Homes in the United States: Perception Versus Reality of Aging-Accessibility Needs: 2019
- Publisher
- U.S. Census Bureau
- Release
- 2023-10-10. Table 1a and definition checked 26 September 2026. These are 2019 observations.
- Coverage
- United States and nine Census divisions. Occupied housing units, including houses, apartments and mobile homes. 2019.
- Method
- Respondent-reported housing features. Aging-ready means a step-free entry plus a bedroom and full bathroom on the first floor. This is a basic layout definition, not an accessibility certification. Weighted American Housing Survey estimates; the report provides standard errors in its appendix.
- Reuse
- U.S. federal statistical data. Census source acknowledged; no endorsement implied. Source reuse information
Publication and authors · Current AHS releases · Survey history and coverage
Cite this research
Credit the original source when using its estimates. For our derived comparisons, credit The Room Study analysis and retain the population and dates.
The Room Study (2026). How many American homes are aging-ready?. Published 26 September 2026. https://theroomstudy.com/statistics/us-aging-ready-homes. Based on U.S. Census Bureau data; measurement period: 2019 occupied housing stock.
CSV: source estimates and The Room Study calculations. Please keep the source attribution and methodological notes with any reuse.