
Where America’s renovation dollars go
United States · 2023 AHS-based estimates
A new kitchen is easy to picture. A replacement roof rarely makes the mood board. Yet replacements took almost half of the improvement dollars in Harvard’s 2023 AHS-based estimates. This comparison shows where the money went and what those totals can tell us about an individual renovation.
By The Room Study · Published
Data: 2023 AHS-based estimates · Sources checked 26 September 2026
Key findings
JCHS’s 2023 AHS-based estimates put improvements to owner-occupied U.S. homes at approximately $405 billion. Source
Link to findingReplacement projects accounted for 48.7% of that spending, calculated by The Room Study from table A-1. Source
Link to findingKitchen and bath remodels together accounted for 18.4% of the same spending total. Source
Link to finding
What spending does this cover?
The denominator is $404.969 billion in improvements to owner-occupied homes, from table A-1 of Improving America’s Housing 2025. It excludes the report’s rental-property and routine-maintenance totals. The report year is 2025; the underlying survey is 2023.
Treat it as a survey-based spending estimate, rather than a ledger of everything bought during the 2023 calendar year. The AHS improvement questions cover a two-year reporting period; JCHS presents annual-scale estimates. We retain its published values without re-estimating them.
For every $100 of improvement spending
The Room Study divides each project category by the same total. Exterior and interior replacements, plus systems and equipment, together account for about $49 of every $100. Kitchen and bath remodels account for about $18.
These are shares of dollars, not shares of homeowners or projects. A costly job contributes more to this chart than a modest one. A single household can undertake several different kinds of work.
The share taken by each project category
Owner-occupied home improvements · 2023 AHS-based estimates (%)

The Room Study calculations from Harvard JCHS table A-1, based on the 2023 AHS. Shares of spending, not project counts. Method and limits
Download chart (SVG)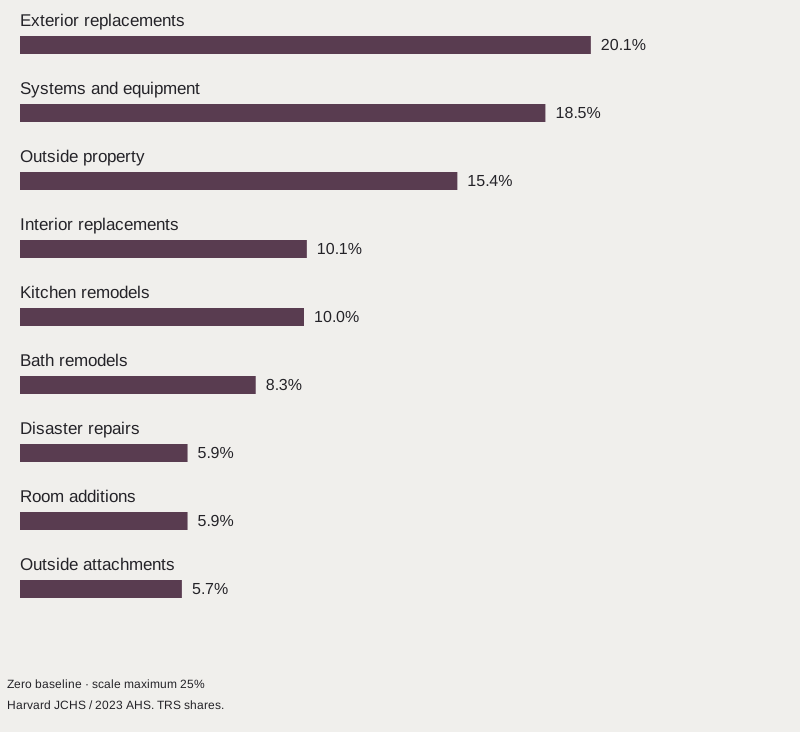
| Project category | Spending ($bn) | Share of total |
|---|---|---|
| Exterior replacements | 81.312 | 20.1% |
| Systems and equipment | 74.975 | 18.5% |
| Outside property | 62.516 | 15.4% |
| Interior replacements | 40.858 | 10.1% |
| Kitchen remodels | 40.674 | 10.0% |
| Bath remodels | 33.723 | 8.3% |
| Disaster repairs | 23.982 | 5.9% |
| Room additions | 23.926 | 5.9% |
| Outside attachments | 23.003 | 5.7% |
| Total | 404.969 | 100.0% |
How should a homeowner use these figures?
Use the categories as a prompt for your own scope of work. Before choosing finishes, make room in the plan for whatever the building itself needs. A roof, wiring or heating system will compete for the same budget as a kitchen, even when it sits outside the photograph.
Do not allocate your budget in the national proportions. A sound roof may need nothing; a failed one may take most of the available money. A whole-market share cannot price your project, predict a local contractor’s quote or establish what a renovation will add to a home’s value.
Why do other remodeling totals look different?
Check the denominator before comparing headlines. Owner improvements, owner improvements plus maintenance, and work on both owner-occupied and rental homes are different markets. A forecast also answers a different question from a survey estimate.
Keep nominal dollars separate from inflation-adjusted trends. This page compares categories within one published table; it does not claim that spending growth means more work was completed, or use a forecast as a measured outcome.
Methodology & sources
Spending shares = category expenditure ÷ total expenditure × 100. The downloadable CSV keeps the source workbook’s values in millions of dollars, cell references and the derived shares. All arithmetic uses those unrounded values; display percentages use one decimal. Rounded shares may not sum to exactly 100%. The workbook’s nine category values exceed its published total by $0.131 million (about 0.00003%); we retain the published total as the denominator rather than silently adjusting it.
Replacement share combines the source’s exterior, interior, and systems/equipment groups. Kitchen and bath share combines remodels, excluding the separately classified room additions. We independently checked the arithmetic against the workbook and the rounded report table; we did not reproduce JCHS’s microdata tabulations.
Survey reporting and sampling uncertainty remain. These descriptive calculations have no new confidence intervals or significance tests. DIY expenditure and professionally installed work also have different cost coverage, so this table cannot establish savings from doing a job yourself.
We review these resources when the underlying releases change. A review date does not make a figure expire: its measurement period stays visible until a checked revision replaces it.
Improving America’s Housing 2025: table A-1
- Publisher
- Harvard Joint Center for Housing Studies
- Release
- 2025-03-20. Original workbook and report checked 26 September 2026.
- Coverage
- United States. Improvements to owner-occupied homes. 2023 AHS-based spending estimates.
- Method
- JCHS analysis of HUD’s 2023 American Housing Survey. Spending estimates use survey reports, not a census of invoices. Professional and DIY work are included. Published weighted tabulations; no new microdata analysis by The Room Study.
- Reuse
- Selected numerical facts and original derived comparisons with attribution. The Harvard workbook, report and interactive are not redistributed.
Original report · Source release · AHS annualization background
Cite this research
Credit the original source when using its estimates. For our derived comparisons, credit The Room Study analysis and retain the population and dates.
The Room Study (2026). Where America’s renovation dollars go. Published 26 September 2026. https://theroomstudy.com/statistics/us-home-renovation-spending. Based on Harvard Joint Center for Housing Studies data; measurement period: 2023 AHS-based estimates.
CSV: source estimates and The Room Study calculations. Please keep the source attribution and methodological notes with any reuse.