
Which American homes need repairs?
United States · 2023 housing conditions · 2024 repair costs
A repair bill can remain unpaid for years. That makes outstanding repair needs a different measure from the money households spend in a year. The Philadelphia Fed’s December 2025 research estimates a $198.4 billion backlog, using reported housing conditions in 2023 and contractor costs in 2024.
By The Room Study · Published
Data: 2023 housing conditions · 2024 repair costs · Sources checked 26 September 2026
Key findings
The Philadelphia Fed estimates $198.4 billion of outstanding repair needs from 2023 housing conditions, priced using 2024 contractor costs. Source
Link to findingIn all four regions, homes built before 1980 had a higher estimated prevalence of repair needs than later homes. The descriptive gaps ranged from 10.4 to 13.3 percentage points. Source
Link to findingIn the Northeast, estimated repair needs affected 43.6% of rented homes and 34.6% of owned homes, a 9.0-percentage-point descriptive gap. Source
Link to findingThe South’s estimated repair bill was $80.4 billion. Its 36.0% prevalence shows why a large total bill should not be read as a high probability for an individual home. Source
Link to finding
What does the repair estimate measure?
The model connects reported housing problems to possible repairs and prices them using contractor-cost data. It covers 110 repair scenarios, with rules to avoid counting overlapping work twice. A home with no estimated cost may still have problems the survey or model does not capture.
This is not an annual maintenance budget, an amount already spent, or a quote for bringing every home to an ideal standard. It also cannot identify all hazards: the research does not price every unobserved problem, including lead-paint and water-contamination risks.
Age and tenure reveal more than the total bill
Across each of the four regions, the published pre-1980 group has a higher prevalence of repair needs than the later-built group. Our subtraction puts those gaps between 10.4 and 13.3 percentage points. That pattern warrants attention, but it does not show that age alone caused the difference.
Rented homes also have higher point estimates than owned homes in each region. Income, building type, maintenance history and other factors can differ between these groups. The chart and table describe the published comparisons; they do not adjust for those factors or rank regions by statistical significance.
The older-home repair-needs gap
Pre-1980 minus 1980-or-later prevalence · percentage points

The Room Study subtractions from Philadelphia Fed data appendix, December 2025, pages 2–5. Descriptive gaps, not significance tests. Method and limits
Download chart (SVG)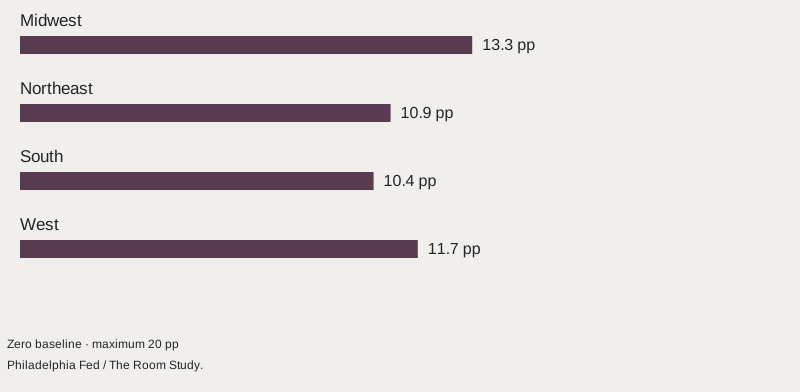
| Region | All homes | Owned | Rented | Before 1980 | 1980 or later | Age gap (pp) |
|---|---|---|---|---|---|---|
| Midwest | 36.1% | 34.6% | 39.7% | 41.5% | 28.2% | 13.3 |
| Northeast | 37.9% | 34.6% | 43.6% | 41.3% | 30.4% | 10.9 |
| South | 36.0% | 33.6% | 40.8% | 42.5% | 32.1% | 10.4 |
| West | 37.4% | 36.4% | 38.8% | 43.5% | 31.8% | 11.7 |
A bigger bill does not mean a worse typical home
The South has the largest total bill among the four regions, at $80.4 billion. Its estimated prevalence of repair needs is 36.0%, compared with 37.9% in the Northeast. Population size and the mix and cost of repairs all contribute to a regional total.
The four rounded regional cost figures sum to $198.3 billion, while the report’s national estimate is $198.4 billion. That rounding difference should not be “corrected” by changing a region’s number. Likewise, the report’s mean and median costs cover only homes with positive estimated repair costs.
What should come before a room refresh?
The useful distinction is between improving how a room looks and understanding what the building needs. A national estimate cannot tell us what is wrong with a particular home. It can remind us to establish the condition of the building before allocating the whole budget to furniture and finishes.
Our housing-age page provides a separate 2024 view of where older occupied homes are concentrated. The two pages support different questions. Their records have not been matched, and we do not multiply the 2024 age shares by these repair rates to manufacture a new national estimate.
Methodology & sources
The source is the Philadelphia Fed’s December 2025 brief and regional data appendix, pages 2–5. Conditions come from the 2023 AHS public-use file; prices come from 2024 Gordian RSMeans contractor-cost data. The table denominator is all occupied homes in each named group, not only homes that need repairs.
The Room Study calculated the age gap as the published pre-1980 percentage minus the published 1980-or-later percentage. The tenure gap is rented minus owned. These simple subtractions were independently reproduced; they use one-decimal source estimates. The CSV preserves those inputs, the source page and units.
We have not reproduced the Fed’s full repair-cost model or licensed cost database. Sampling, reporting and model uncertainty remain. The regional appendix does not supply confidence intervals for the displayed comparisons, and this page adds no significance test. No region is labeled “worst,” and age is not treated as a cause.
Cooling repairs were added in this release and account for about 9% of the total. Other methodological changes also affect comparisons. This page therefore does not treat the raw headline change from an earlier report as a like-for-like trend. The source has a separate consistent-needs comparison; our scope here is the four-region cross-section.
The report covers selected metropolitan areas as well as regions, but it is not a complete 50-state estimate. We publish no unsupported state ranking. Selected numerical facts and our comparisons are shared with attribution; the source reports and licensed repair-cost inputs remain with their publishers.
We review these resources when the underlying releases change. A review date does not make a figure expire: its measurement period stays visible until a checked revision replaces it.
Home Repair Costs 2025: brief, technical appendix and regional data appendix
- Publisher
- Federal Reserve Bank of Philadelphia
- Release
- 2025-12. Report and regional tables checked 26 September 2026.
- Coverage
- United States and four Census regions. Occupied housing units in the 2023 American Housing Survey. 2023 American Housing Survey conditions, valued at 2024 repair costs.
- Method
- Reported deficiencies are mapped to 110 repair scenarios and custom Gordian RSMeans contractor-cost estimates. Overlap rules prevent double counting. Medians and means concern homes with positive estimated costs. Published weighted AHS estimates and modeled repair costs; no new survey by The Room Study.
- Reuse
- Selected attributed numerical facts and original percentage-point comparisons. The report, licensed RSMeans cost database and underlying repair model are not redistributed.
Original research brief · Regional data appendix: pages 2–5 · Technical appendix
Cite this research
Credit the original source when using its estimates. For our derived comparisons, credit The Room Study analysis and retain the population and dates.
The Room Study (2026). Which American homes need repairs?. Published 26 September 2026. https://theroomstudy.com/statistics/us-home-repair-needs. Based on Federal Reserve Bank of Philadelphia data; measurement period: 2023 housing conditions · 2024 repair costs.
CSV: source estimates and The Room Study calculations. Please keep the source attribution and methodological notes with any reuse.