
How old are America’s homes?
United States · 2024 primary occupied homes · preliminary
Almost half the homes Americans live in were built before 1980. But a national average hides a very different starting point for a room in the Northeast and one in the South. Our analysis separates those regions, then looks at the homes people own and rent.
By The Room Study · Published
Data: 2024 primary occupied homes · preliminary · Sources checked 26 September 2026
Key findings
About 47.7% of primary occupied U.S. homes were built before 1980 in the preliminary 2024 RECS. The Room Study calculated the share from survey weights. Source
Link to findingThe pre-1980 share was 66.9% in the Northeast and 35.5% in the South: a 31.3-percentage-point difference calculated before rounding. Source
Link to findingAmong owner-occupied homes, 48.0% were built before 1980; our approximate 95% jackknife interval is 47.3%–48.7%. Source
Link to findingAmong rented homes, including homes occupied without rent, 47.1% were built before 1980; our approximate 95% jackknife interval is 45.6%–48.5%. Source
Link to finding
Which homes are counted?
This is the age of occupied homes, including apartments and mobile homes as well as houses. It excludes vacant properties, second homes and seasonal homes. “Before 1980” groups four published construction periods; it is a useful dividing line in the available data, not a definition of good or bad housing.
A home’s construction period tells us when it began life. It cannot tell us when the wiring was replaced, whether a bathroom was adapted, or how well the building has been maintained. We do not turn age into a repair diagnosis.
Where are older homes concentrated?
The Northeast has the largest pre-1980 share of the four regions. In the South, roughly one home in three belongs to that group. Both owners and renters follow this broad regional pattern.
The national owner and renter estimates are close. Their uncertainty intervals overlap, and this page makes no claim that tenure itself explains housing age. The table supplies the regional detail instead of reducing the country to an “oldest homes” ranking.
Primary occupied homes built before 1980
The Room Study weighted analysis · 2024 RECS preliminary (%)

The Room Study analysis of EIA 2024 RECS public file v1 (May 2026). All-tenure margins are benchmark-calibrated. Method and limits
Download chart (SVG)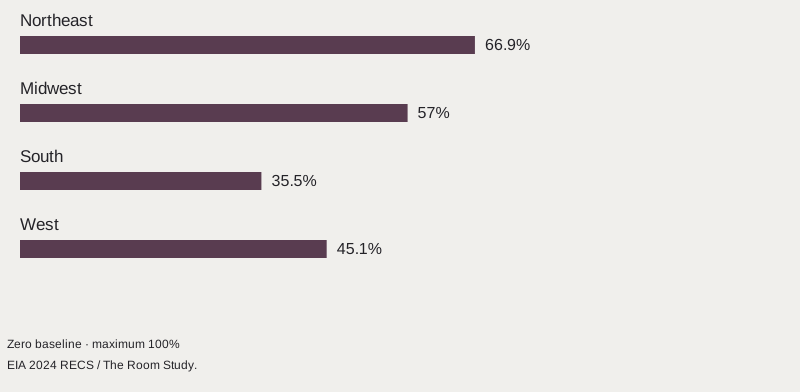
| Region | All tenures | Owners (95% interval) | Renters (95% interval) |
|---|---|---|---|
| United States | 47.7% · benchmark-calibrated | 48.0% (47.3–48.7) | 47.1% (45.6–48.5) |
| Northeast | 66.9% · benchmark-calibrated | 66.6% (65.3–68.0) | 67.3% (65.0–69.6) |
| Midwest | 57.0% · benchmark-calibrated | 57.4% (55.9–58.8) | 56.1% (52.5–59.7) |
| South | 35.5% · benchmark-calibrated | 36.4% (35.5–37.3) | 33.7% (31.6–35.7) |
| West | 45.1% · benchmark-calibrated | 45.6% (43.9–47.3) | 44.1% (41.0–47.2) |
Why are some uncertainty figures left blank?
EIA aligns construction-period totals with Census benchmarks. For all tenures together, the replicate estimates barely move because those margins are fixed by the weighting process. Publishing that tiny variation as a near-perfect confidence interval would be misleading. The table labels those rows “benchmark-calibrated” instead.
Owner/renter intersections can vary across the replicate samples, so we show approximate 95% intervals for them. These describe sampling uncertainty conditional on the calibration. They do not include every source of error in the underlying Census benchmarks, respondent answers or imputation.
What does this mean for a room plan?
For our design studies, the useful question is what the existing building asks us to work with: the position of windows, the depth of a room, the route to a bathroom, or a door that takes up the only clear wall. An older construction date is a reason to investigate those particulars.
The companion repair-needs page measures reported problems using a separate survey and cost model. Read it alongside this analysis for context, but do not combine the two datasets as though they describe the same households.
Methodology & sources
The Room Study analyzed all 16,676 records in recs2024_public_v1.csv. We sum NWEIGHT where YEARMADERANGE is 1, 2, 3 or 4, divide by all NWEIGHT in the relevant group, and multiply by 100. REGIONC supplies the four Census regions. KOWNRENT = 1 means owned; 2 and 3 are combined as rented, including occupied without payment. No records are dropped for these variables.
For each region–tenure estimate, we recalculate the numerator and denominator with NWEIGHT1 through NWEIGHT60. Variance = (59/60) × the sum of squared deviations of those 60 estimates from the full-weight estimate. Intervals use estimate ± 2 standard errors, following the approximate 95% convention in EIA’s guide with 59 degrees of freedom. All-tenure construction margins are calibrated: their near-zero replicate errors are suppressed, not interpreted as certainty.
A separate row-by-row JavaScript implementation independently reproduced the Python weighted sums and jackknife calculations from the original CSV. Weighted home totals and mean floor areas also reconcile to the official rounded tables. The downloadable aggregate CSV retains denominators, sample counts, standard errors and interval flags. The linked Python script reproduces the age analysis from the public source file.
All calculations use unrounded weights. Display percentages are rounded to one decimal, so subtracting two displayed shares may differ by 0.1 point from a difference calculated before rounding. Preliminary 2024 data were released in 2026; this is not a 2026 stock estimate. No median year built, state ranking, causal effect or time trend is inferred from the grouped years.
We review these resources when the underlying releases change. A review date does not make a figure expire: its measurement period stays visible until a checked revision replaces it.
2024 RECS preliminary public-use microdata and construction-period tables
- Publisher
- U.S. Energy Information Administration
- Release
- 2026-05. Public file version 1 and March 2026 tables checked 26 September 2026.
- Coverage
- United States. Housing units occupied as primary residences in the 50 states and District of Columbia. 2024 reference year; household fieldwork October 2024 to April 2025.
- Method
- Weighted survey, calibrated to 2024 ACS housing totals. The Room Study groups construction categories 1–4 as before 1980 and cross-tabulates region and tenure. Sixty jackknife replicate weights quantify conditional sampling uncertainty. 16,676 responding households, representing approximately 132.5 million primary occupied homes.
- Reuse
- Public-domain U.S. federal statistics, with EIA and release dates acknowledged. No endorsement implied. Source reuse information
Public CSV · Variable codebook · Weights, replicates and disclosure protection · Construction period by tenure: HC2.2 · Northeast and Midwest: HC2.7 · South and West: HC2.8 · The Room Study reproduction script (Python)
Cite this research
Credit the original source when using its estimates. For our derived comparisons, credit The Room Study analysis and retain the population and dates.
The Room Study (2026). How old are America’s homes?. Published 26 September 2026. https://theroomstudy.com/statistics/us-housing-age. Based on U.S. Energy Information Administration data; measurement period: 2024 primary occupied homes · preliminary.
CSV: source estimates and The Room Study calculations. Please keep the source attribution and methodological notes with any reuse.