
Keeping a home warm and dry should not feel like a trade-off
England · English Housing Survey 2024–25, pooled household subsample
Turning the heating down and opening a window can feel like opposing instructions when there is condensation on the glass. England’s housing survey shows that difficulty keeping warm and reported damp often occur together. The useful lesson is to consider warmth, moisture and the building as one problem, rather than making the clothes airer carry all the blame.
By The Room Study · Published
Data: English Housing Survey 2024–25, pooled household subsample · Sources checked 18 October 2026
Key findings
31.1% of households reported condensation, damp or mould in the EHS paired household subsample. Source
Link to findingReported damp affected 58.3% of households unable to keep comfortably warm in winter. Source
Link to findingReported damp affected 27.0% of households able to keep comfortably warm in winter. Source
Link to finding12.9% of households answering the warmth question said they were unable to keep comfortably warm in winter. Source
Link to finding
Warmth and damp overlap
In the EHS household subsample, 31.1% of households reported an issue with condensation, damp or mould. Among those saying they could not keep comfortably warm in winter, that proportion was 58.3%; among those able to keep warm, it was 27.0%. The warmth question concerns the living room during cold winter weather, so it should not be read as a temperature measurement of every room.
The comparison is striking, but it is not an instruction to solve damp by turning up the thermostat. The survey observes households and their circumstances. It does not assign heating levels, repair buildings or measure what happens after a change. A home’s condition, heating, ventilation and the resources available to its occupants may all matter.
A resident’s report and a surveyor’s inspection answer different questions
Residents reported damp much more often than surveyors recorded it. In the paired sample, the surveyor-assessed damp share was 5.5% overall, compared with 31.1% for household reports. The official report explains that some household concerns may be less extensive than the surveyor’s assessment threshold, occur in different rooms, or be absent on the day of the visit.
The association with warmth appears in both measures. Surveyors recorded damp in 11.2% of homes whose households could not keep warm, compared with 4.6% where they could. These lower shares do not cancel the reported experiences. They describe a different assessment, made under different conditions.
That distinction is useful when a problem comes and goes. Photographs, the affected location and a record of recurrence can help describe what an inspection needs to investigate. Government guidance recommends documenting mould before removal and addressing the underlying cause. A clean-looking wall on one day is not, by itself, a history of the room.
Damp is more common where households cannot keep warm
Separate measures, compared within the same warmth groups. England, EHS 2024–25 household subsample.

Data: MHCLG, EHS Annex Tables 2.3 and 2.4. Reported damp includes condensation, damp or mould. Surveyor-assessed damp is a separate measure. Association does not establish causation. Chart: The Room Study. Method and limits
Download chart (SVG)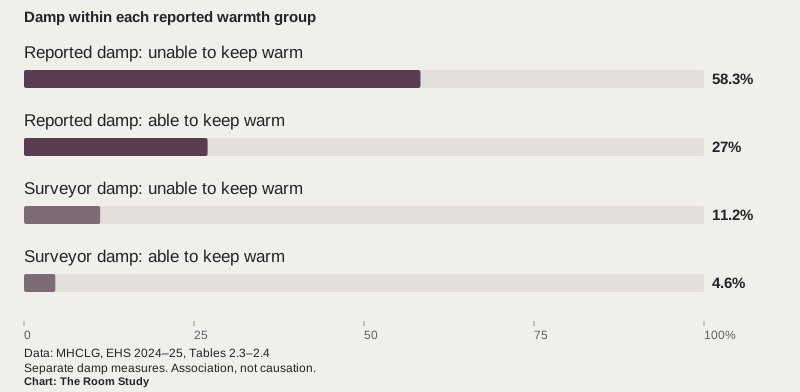
| Measure | Population | Share | Usable sample |
|---|---|---|---|
| Reported condensation, damp or mould | All households in the table | 31.1% | 14,491 |
| Reported condensation, damp or mould | Unable to keep warm | 58.3% | 2,051 |
| Reported condensation, damp or mould | Able to keep warm | 27.0% | 12,238 |
| Surveyor-assessed damp | All households in the table | 5.5% | 14,501 |
| Surveyor-assessed damp | Unable to keep warm | 11.2% | 2,051 |
| Surveyor-assessed damp | Able to keep warm | 4.6% | 12,245 |
| Unable to keep warm | Households answering the warmth question | 12.9% | 14,296 |
The experience is uneven
Reported damp affected 47.3% of private-renting households, 45.9% of local authority renters, 39.3% of housing association renters and 23.7% of owner occupiers in this table. Each percentage uses its own tenure group as the denominator. These figures describe housing experiences; they do not rank the care residents take of their homes.
Across the subsample, 12.9% said they were unable to keep warm. That includes a variety of situations which the headline cannot separate. A household may face inadequate heating, a hard-to-heat building, unaffordable running costs or a combination. It would be a mistake to turn the national number into a diagnosis of one flat.
The practical consequence is to ask what the home permits someone to do. Advice that depends on an unused spare room, outdoor drying space or unrestricted control of the heating will not fit every household.
Laundry belongs in the home’s brief
Government guidance recognises cooking, bathing and drying laundry as normal sources of indoor moisture. It explicitly rejects blaming damp and mould on tenants’ lifestyle choices, and points to building deficiencies, inadequate ventilation, inadequate heating and poor energy efficiency as underlying issues that need attention.
That leaves an ordinary design question which is too often postponed: where will a wet wash go? In a small home, record the space the airer actually occupies, whether it obstructs circulation and what ventilation arrangements serve that location. A cupboard for clean linen and a place for wet laundry are different requirements.
The EHS figures cannot tell us how much of the reported damp is connected with indoor drying, how long a particular load should take, or which appliance would be cheapest. We would not put a running-cost saving or a guaranteed drying time beside this chart. Those claims require their own measurements, conditions and prices.
Make the next step specific
If damp is present, begin with the location and pattern: where it appears, when it returns, whether there are visible leaks and whether existing heating or extract equipment is working. Record the problem and report it promptly to the person responsible for the property. The purpose is to support investigation, not to delay it while collecting a perfect diary.
The government’s guidance calls for underlying causes to be addressed, rather than simply removing surface mould. It also treats ventilation and energy-efficiency improvements together. This is a useful question for any proposed work: after the change, how will moisture leave the home while it remains reasonably warm?
For a room plan, keep necessary ventilation accessible and allow the existing system to work as intended. Ask a competent professional about defective or inadequate equipment. Repositioning furniture or changing a domestic routine may form part of a response, but the statistics provide no basis for presenting either as a substitute for a building repair.
A shared problem is not a single cause
The figures show a relationship between reported warmth and damp; they do not prove that either one caused the other. They also do not establish a universal humidity target, heating schedule or ventilation duration. The right response depends on the home and on the source of the moisture.
What the data do support is a better conversation about comfort. Before a room is called cosy, consider whether its occupants can keep it warm, dry their clothes and use the ventilation without finding themselves caught between incompatible instructions. Those are basic parts of living in the room.
Methodology & sources
We checked the original Chapter 2 ODS annex on 18 October 2026. Table 2.3 records household-reported damp, Table 2.4 surveyor-assessed damp and Table 2.9 temperature perceptions. These use the paired household and physical-survey subsample, not the full single-year interview sample used for the noise tables.
The paired sample contains 14,501 households from the combined 2023–24 and 2024–25 collection years. DESNZ’s 2026 fuel-poverty methodology describes this EHS data period as 1 April 2023 to 31 March 2025. The housing-quality report labels the household tables 2024–25. The reference to 2026 is the publication date, not a new set of 2026 household observations.
Item-response bases differ. Reported damp has 14,491 observations overall; the warmth comparison uses 2,051 unable-to-keep-warm and 12,238 able-to-keep-warm responses. The surveyor comparison uses 2,051 and 12,245 respectively. Table 2.9’s warmth question has 14,296 usable responses. Percentages are weighted estimates, not the unweighted proportion obtained from these counts.
The warmth question asks about keeping comfortably warm in the living room during cold winter weather. It is subjective and does not report measured indoor temperature. Household-reported damp, surveyor-assessed damp and the most serious Category 1 damp hazards are different measures; the Category 1 measure is not plotted here.
We retain the annex’s one-decimal percentages and do not reconstruct counts from rounded numbers. No new significance test, causal model or appliance comparison has been performed. Practical context comes from the linked government guidance; it is separate from what the statistical tables themselves establish.
We review these resources when the underlying releases change. A review date does not make a figure expire: its measurement period stays visible until a checked revision replaces it.
English Housing Survey 2024 to 2025: household damp and warmth, Annex Tables 2.3, 2.4 and 2.9
- Publisher
- Ministry of Housing, Communities & Local Government
- Release
- 2026-07-09. Original Chapter 2 ODS tables checked 18 October 2026; one-decimal table values retained.
- Coverage
- England. Households in the paired interview and physical-inspection subsample; item non-responses excluded where specified. 2024–25 report; pooled 2023–24 and 2024–25 household/physical-survey subsample.
- Method
- Weighted estimates. Household reports and surveyor observations are separate measures. The paired EHS data cover April 2023 to March 2025; the report labels these household tables 2024–25. This is a cross-sectional association, not a heating intervention. 14,501 paired households overall; 14,491 in the reported-damp table; 14,296 answering the warmth question.
- Reuse
- Crown copyright, Open Government Licence v3.0 except identified third-party material. Source reuse information
Original Chapter 2 annex (ODS) · Survey technical notes · DESNZ explanation of the pooled 14,501-household EHS sample (section 1.2)
Understanding and addressing the health risks of damp and mould in the home
- Publisher
- Department of Health and Social Care, Ministry of Housing, Communities & Local Government, and UK Health Security Agency
- Release
- 2023-09-07. Updated 1 April 2026; checked 18 October 2026.
- Coverage
- England. Guidance for rented housing providers, with information for tenants. Current guidance checked October 2026.
- Method
- Government guidance developed with housing and health specialists. Used here for the distinction between everyday moisture production and underlying building, ventilation and heating problems. Not a statistical sample.
- Reuse
- Crown copyright, Open Government Licence v3.0 except identified third-party material. Source reuse information
Cite this research
Credit the original source when using its estimates. For our derived comparisons, credit The Room Study analysis and retain the population and dates.
The Room Study (2026). Keeping a home warm and dry should not feel like a trade-off. Published 18 October 2026. https://theroomstudy.com/statistics/england-cold-homes-and-damp. Based on Ministry of Housing, Communities & Local Government and Department of Health and Social Care, Ministry of Housing, Communities & Local Government, and UK Health Security Agency data; measurement period: English Housing Survey 2024–25, pooled household subsample.
CSV: source estimates and The Room Study calculations. Please keep the source attribution and methodological notes with any reuse.