
The bedroom looks peaceful. Why can you hear everything?
England · English Housing Survey 2024–25
The photograph cannot tell you whether the bedroom faces an early bus route or shares a wall with somebody else’s television. In England’s 2024–25 housing survey, 45.9% of households reported a noise problem in the preceding year. For many of those households, the consequence was felt when they tried to sleep. That makes quiet a question to put to a room plan before choosing the finishing touches.
By The Room Study · Published
Data: English Housing Survey 2024–25 · Sources checked 18 October 2026
Key findings
45.9% of English households reported a noise problem in the preceding year in the 2024–25 EHS. Source
Link to findingRoad traffic was a reported noise problem for 21.7% of households in England. Source
Link to findingAmong households reporting noise problems, 41.8% said their sleep was affected. Source
Link to findingAmong noise-affected local authority renters, 56.1% said their sleep was affected. Source
Link to finding
A noise problem is a reported experience
The survey begins with a broad question: whether the household experienced a problem with any of several noise sources during the previous year. The answer covers everything from road traffic to neighbours, animals and building sites. It does not mean that the sound was constant, that it crossed a measured decibel threshold, or that it happened only in the bedroom.
The distinction matters when reading the headline. A household disturbed by a temporary building project and one repeatedly woken by traffic can both answer yes. The survey identifies the scale of the problem people report, while leaving its timing, intensity and exact route into a particular room unresolved. Those are the details a useful home assessment still needs.
Sleep is where the problem often lands
Among households reporting a noise problem, 41.8% said it affected sleep. That is a smaller population than the one behind the headline: people who had reported no noise problem were not included in this follow-up. The official weighted estimate is 4.72 million households whose sleep was affected, rather than a count of individual people or diagnosed sleep disorders.
The figures differ by tenure. Among noise-affected households, the share reporting an effect on sleep was 35.6% for owner occupiers, 49.4% for private renters, 56.1% for local authority renters and 54.4% for housing association renters. These are useful descriptions of unequal experiences. They do not establish that tenure itself causes the difference, or tell us how much is explained by building type, location or household circumstances.
When noise affects sleep
Percentage within each tenure among households already reporting a noise problem. England, 2024–25.

Data: MHCLG, EHS 2024–25, Annex Table 4.3. Base: households reporting noise problems; 7,449 usable responses overall. Multiple effects could be reported. Chart: The Room Study. Method and limits
Download chart (SVG)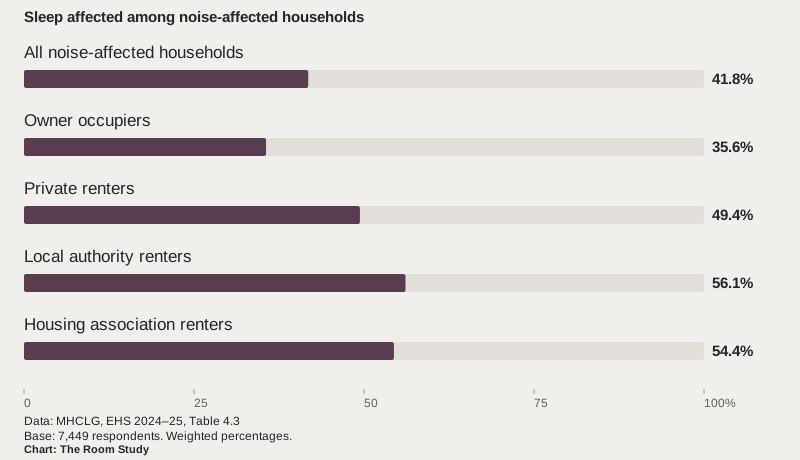
| Measure | Population | Share | Usable sample |
|---|---|---|---|
| Any noise problem | All responding households | 45.9% | 16,197 |
| Road-traffic noise problem | All responding households | 21.7% | 16,197 |
| Sleep affected | All noise-affected households | 41.8% | 7,449 |
| Sleep affected | Noise-affected owner occupiers | 35.6% | 3,668 |
| Sleep affected | Noise-affected private renters | 49.4% | 1,648 |
| Sleep affected | Noise-affected local authority renters | 56.1% | 856 |
| Sleep affected | Noise-affected housing association renters | 54.4% | 1,277 |
The source changes the room question
Road traffic was the most frequently reported source, affecting 21.7% of all households. Noise from immediate neighbours or communal areas affected 10.0%, while other neighbours or people in the street affected 10.1%. A respondent could mention more than one source, so adding these shares would count some households more than once.
That variety is a reason to resist buying something simply because its description contains the word acoustic. If the complaint is buses at the window, establish that as the brief. If it is footsteps overhead, a shared-wall television or voices echoing inside the room, record that instead. A product offered for one problem should not be assumed to solve another.
The survey does not test rugs, curtains, panels, doors or replacement windows. It offers no percentage improvement to attach to any of them. A proposal to spend money should therefore explain which sound it is intended to address, how it will be fitted and what evidence supports the expected result in that situation.
Listen at the times you need the room
A useful starting point is a short record of the room as you actually use it: time, suspected source, what the sound interrupts and which doors or windows are open. Note whether the same event is noticeable elsewhere in the home. This is an observation exercise, not a calibrated acoustic test, but it makes a vague complaint easier to describe to a landlord, designer or acoustic specialist.
Where the layout permits it, compare possible sleeping positions and rooms during the troublesome period before moving large furniture or commissioning work. Include the awkward details: a child who sleeps earlier, a shift worker who needs daytime quiet, or the only room that stays comfortable in hot weather. The survey does not tell us which room to choose; the household’s actual schedule supplies that part of the brief.
For a home viewing, a quiet midday visit gives only a quiet midday answer. Ask about the room at the hour you expect to use it and, where possible, visit again then. There is no national percentage that can substitute for hearing the particular bedroom.
Quiet, fresh air and a comfortable temperature belong together
A window can be central to more than one comfort problem. Closing it may be part of how a household responds to outside noise, while opening it may be part of its usual ventilation or cooling routine. The Association of Noise Consultants and Institute of Acoustics explicitly bring these competing demands together in their residential design guidance.
Keep that whole-room question in any proposed solution. Ask how the room will be ventilated and how it will cope in warm weather, as well as what sound reduction is expected. Blocking a necessary ventilation route is not a complete design response. Where building work is proposed, the assessment needs to consider the building and its ventilation arrangements together.
This is also why a visually calm bedroom is an incomplete promise. A room’s usefulness includes the conditions under which someone can occupy it, and those conditions change over the day and through the year.
What these figures can, and cannot, settle
The English Housing Survey is a national source for England. Its findings should not be relabelled as UK or US figures. Nor do these tables show a rise in noise over time: the comparison here is between groups in one survey period, not a trend.
The reported sleep effect is worth taking seriously without turning it into a medical conclusion. The question did not diagnose insomnia, measure sleep duration or follow the results of an acoustic renovation. For a household, the useful outcome is a more specific brief: which sound, which room, which hour, and what else the proposed change must allow that room to do.
Methodology & sources
Source tables were checked against the original Chapter 4 ODS annex on 18 October 2026. Table 4.1 provides noise prevalence and sources; Table 4.3 provides effects among households reporting a noise problem. The full EHS interview survey contains 16,438 households, with fieldwork from March 2024 to March 2025. After item non-response, the respective table bases are 16,197 and 7,449.
Percentages are weighted estimates; the sample counts are unweighted respondents. The 11.304 million noise-affected households and 4.720 million households reporting sleep effects are the publisher’s weighted counts, rounded to thousands. We have not multiplied rounded percentages to create a new population estimate.
Noise sources and effects allow multiple responses. Rows are not mutually exclusive and should not be summed. The denominator for sleep effects is households reporting noise, not all households. No clinical sleep outcome, product test or causal analysis is present in these tables.
We retain the annex’s one-decimal precision. The narrative report rounds the same estimates to whole percentages. No new statistical-significance test, pooled-country estimate or time trend has been calculated. Room-planning suggestions are editorial applications, separate from the survey findings.
We review these resources when the underlying releases change. A review date does not make a figure expire: its measurement period stays visible until a checked revision replaces it.
English Housing Survey 2024 to 2025: noise and neighbourhoods, Annex Tables 4.1 and 4.3
- Publisher
- Ministry of Housing, Communities & Local Government
- Release
- 2026-07-09. Narrative and original ODS annex checked 18 October 2026.
- Coverage
- England. Households; the effects-of-noise question includes only households reporting a noise problem. 2024–25 household interviews, March 2024 to March 2025; noise experienced in the preceding year.
- Method
- Weighted national sample survey. Tables exclude non-responses. Respondents could identify several noise sources and several effects. These are reported experiences, not measured sound levels or clinical sleep assessments. 16,438 households in the full interview survey; 16,197 usable responses in Table 4.1 and 7,449 in Table 4.3.
- Reuse
- Crown copyright, Open Government Licence v3.0 except identified third-party material. Source reuse information
Original Chapter 4 annex (ODS) · Release and all annex tables · Survey technical notes
Acoustics, Ventilation and Overheating: Residential Design Guide
- Publisher
- Association of Noise Consultants and Institute of Acoustics
- Release
- 2020. January 2020 guide, version 1.1 attachment; publisher introduction checked 18 October 2026.
- Coverage
- United Kingdom. Residential design guidance, not a household prevalence study. 2020 design guidance.
- Method
- Used for the need to consider acoustic comfort, ventilation and overheating together. No product-performance or regulatory-compliance claim is inferred. Not a statistical sample.
- Reuse
- Short attributed discussion and link to the original guidance; no guide pages or diagrams redistributed.
Cite this research
Credit the original source when using its estimates. For our derived comparisons, credit The Room Study analysis and retain the population and dates.
The Room Study (2026). The bedroom looks peaceful. Why can you hear everything?. Published 18 October 2026. https://theroomstudy.com/statistics/england-home-noise-and-sleep. Based on Ministry of Housing, Communities & Local Government and Association of Noise Consultants and Institute of Acoustics data; measurement period: English Housing Survey 2024–25.
CSV: source estimates and The Room Study calculations. Please keep the source attribution and methodological notes with any reuse.