
Household clutter: what gets moved, and who deals with it
United Kingdom and 31 surveyed IKEA markets · April 2026 survey
The room is ready for visitors. The things that were on the table are now behind another door. IKEA’s 2026 research puts a number on that familiar manoeuvre: 49% of UK respondents reported moving clutter between rooms before guests arrived. The harder question is what happens after the visit.
By The Room Study · Published
Data: April 2026 survey · Sources checked 18 October 2026
Key findings
49% of UK respondents said they move clutter between rooms before guests arrive. Source
Link to finding34% was the equal-weight average across the 31 surveyed markets for moving clutter between rooms before guests arrive. Source
Link to finding38% across the surveyed markets reported someone in their household leaving things out in the hope that another person would deal with them. Source
Link to finding
What the rush before visitors tells us
A hurried tidy has a precise aim: make the rooms someone will see presentable in the time available. Moving a stack of papers into a bedroom can meet that aim perfectly. It leaves the question of where those papers belong for another day.
The survey records that action, without telling us how frequently people do it or how much they move. A person who clears a table once before a party and someone who repeats the ritual every weekend may both be included. The figure cannot tell us how untidy a typical British home is.
A UK result beside an equal-market average
IKEA reports 49% for the UK and 34% across the 31 markets it surveyed. In that second figure, each market receives the same weight. A market with a smaller population contributes as much as a larger one. It is a useful comparison within this study, with the UK also included in the average.
The chart therefore labels its two bars differently. Neither the reported average nor the selected national examples can establish a world ranking for tidiness. The study does not publish the information needed here to test the UK difference for statistical significance.
Moving clutter before guests arrive
UK respondents and the equally weighted average of 31 surveyed markets, April 2026

Data: IKEA Store & Organise Report 2026, research by YouGov. Chart: The Room Study. UK and item counts are not published; the 31-market comparator gives each market equal weight. Method and limits
Download chart (SVG)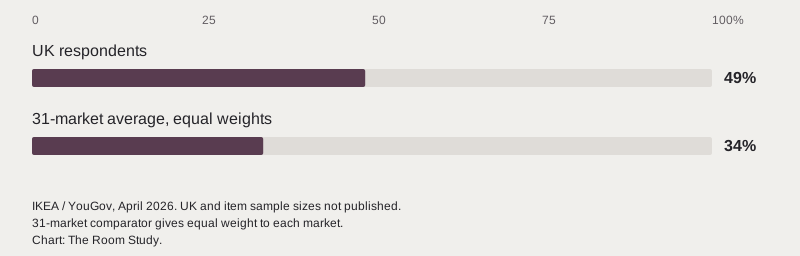
| Measure | Reported share | Who the figure describes |
|---|---|---|
| Moving clutter between rooms before guests | 49% | UK survey respondents |
| Same behaviour, across surveyed markets | 34% | 31-market average; equal weight per market |
| Someone leaves items for another person to deal with | 38% | Household behaviour reported across 31 equally weighted markets |
| Household catch-all drawer or box | 68% | 31-market average; report p6; item base not supplied |
| Keeping possessions for sentimental reasons | 82% | 31-market average; report p10; item base not supplied |
| Preference for a lived-in feel | 59% | 31-market style preference; report p10 |
| Preference for a minimalist approach | 24% | 31-market style preference; report p10 |
The thing left for somebody else
A separate question reaches beyond the guest-ready room. Across the surveyed markets, 38% reported someone in their household leaving things out hoping another person would deal with them. IKEA calls this a silent protest. That is the report’s interpretation of an answer about household behaviour, rather than an observation of what any particular person intended.
For a shared home, it raises a useful design question: when an object is left out, is its next destination obvious to everyone? A basket may be a permanent home to one person and a temporary holding place to another. Before choosing more storage, agree what the item is waiting for and who completes that next step.
Keeping an object is different from keeping it in view
The report finds a household catch-all drawer or box in 68% of responses across its markets. It also reports that 82% keep possessions for purely sentimental reasons. A drawer of unassigned objects and an intentionally kept memory deserve separate questions: does this need a usable destination, or have I already decided that keeping it matters?
Appearance is another measure again. In the report’s style-preference figures, 59% favour a lived-in feel and 24% a minimalist approach. Those answers describe taste, without measuring how tidy a home is. They also do not demonstrate a move away from minimalism over time. I would distinguish what deserves a place in the home from what should remain on display, then give the pieces chosen for display enough room to be seen.
Read the place where things accumulate
Choose one surface that needs clearing repeatedly and look at what lands there. Post awaiting a decision, a bag needed tomorrow and a charger used every evening ask different things of the room. Grouping them together as clutter makes it harder to decide whether they need a reachable home, a reminder or a scheduled task.
My starting point would be the route each object takes. A place near the entrance may suit something that leaves with you; paperwork may need to stay visible until it has been dealt with. This is a way to examine your own room. The survey has not tested it, and it does not show that buying a cabinet resolves disagreements about housework.
Give the quick tidy an ending
A temporary destination can still be deliberate. If a room must be cleared quickly, decide when its displaced contents will be sorted and keep them accessible enough to retrieve. Otherwise the newly clear table has simply passed its unfinished work to a less visible part of the home.
The useful follow-up is small enough to observe: which objects return to the same surface, and why? That answer can guide a layout change more closely than an ideal of permanent tidiness. These figures describe reported habits at one moment; they do not show that clutter is increasing or that a household has failed.
Methodology & sources
IKEA commissioned YouGov online fieldwork in April 2026 across 31 markets. The methodology says samples were designed to reflect gender, age and region as far as possible. Global figures give each market equal weight; they are not estimates weighted to the world’s population.
We checked the original report and IKEA announcement on 18 October 2026. Page 7 of the report prints 31,448 respondents, while the announcement gives 31,488. We retain that unresolved discrepancy rather than silently selecting a sample count. The UK sample, item-response counts and full question wording are not supplied.
The pre-guest figures appear on report page 15; the household behaviour figure appears on page 14. We preserve the published whole percentages and do not infer respondent counts or test differences. A retailer commissioned the research: the results do not independently establish that additional storage improves household relationships.
The catch-all drawer or box result appears on report page 6; sentimental possessions and style preferences appear on page 10. The report gives narrative descriptions rather than a full questionnaire or item bases. Its selected style figures are not an exhaustive response distribution; we do not force them to total 100%. All these additional results use the equally weighted market comparison, not a UK-only base.
We review these resources when the underlying releases change. A review date does not make a figure expire: its measurement period stays visible until a checked revision replaces it.
IKEA Store & Organise Report 2026: Finding Meaning in the Mess
- Publisher
- IKEA; fieldwork by YouGov
- Release
- 2026-08-24. Release date follows the accompanying IKEA announcement. The report prints an overall sample of 31,448; the announcement says 31,488. The discrepancy is unresolved. Selected percentages agree between the two sources.
- Coverage
- 31 IKEA markets; UK figures identified separately. Respondents to national online consumer panels in 31 markets where IKEA is present. The report does not supply an age threshold or the full questionnaire.. April 2026 fieldwork.
- Method
- IKEA-commissioned online research by YouGov, April 2026. Samples designed to be nationally representative as far as possible by gender, age and region. Each market receives equal weight in the reported global figures. 31,448 respondents in report page 7; 31,488 in the press release. UK and item-response counts are not supplied..
- Reuse
- Selected factual aggregates attributed to IKEA. No open reuse licence established; report artwork and respondent-level data are not reproduced.
Cite this research
Credit the original source when using its estimates. For our derived comparisons, credit The Room Study analysis and retain the population and dates.
The Room Study (2026). Household clutter: what gets moved, and who deals with it. Published 18 October 2026. https://theroomstudy.com/statistics/household-clutter. Based on IKEA; fieldwork by YouGov data; measurement period: April 2026 survey.
CSV: source estimates and The Room Study calculations. Please keep the source attribution and methodological notes with any reuse.