
Where working from home actually fits
United Kingdom · 2024 survey; research published February 2026
A home office is only one way that paid work occupies a home. In the 2024 UK Skills and Employment Survey, 28.6% of people working at home used spaces also intended for other purposes. Another 24.8% had a permanent workstation without a separate office. Those arrangements ask different things of a room at the end of the day.
By The Room Study · Published
Data: 2024 survey; research published February 2026 · Sources checked 18 October 2026
Key findings
28.6% of UK respondents working at home reported: space also used for other purposes. Source
Link to finding24.8% of UK respondents working at home reported: permanent workstation, no office. Source
Link to finding41.1% of UK respondents working at home reported: own home office. Source
Link to finding
Four arrangements behind one phrase
The research separates an office of your own, an office shared with someone else, a permanent workstation without an office, and space also intended for other uses. The last category can include a kitchen or dining table. It does not mean every person in it works at a dining table, and the study does not identify one particular piece of furniture.
This distinction is useful when planning a room. A desk that stays set up needs a continuing place in the layout. A table that returns to meals needs somewhere for the working equipment to go. Both can appear in a photograph of working from home, but the second arrangement has an extra daily transition to accommodate.
A separate office is one part of the picture
In the published table, 41.1% had their own home office and 5.5% shared an office. The remaining categories were a permanent workstation, at 24.8%, and spaces also used for other purposes, at 28.6%. The four weighted shares describe respondents who worked at home, rather than the entire UK workforce.
The findings come from the 2024 survey and were published in 2026. That distinction matters: the publication date does not make them a measurement of homes in 2026. Nor does a single survey establish whether shared rooms or temporary work surfaces are becoming more common.
The spaces UK home workers use
Weighted shares among respondents working at home, Skills and Employment Survey 2024

Data: Felstead et al., Industrial Relations Journal (2026), Table 3; Skills and Employment Survey 2024. Weighted UK shares, 2,543 observations across the four categories. Chart: The Room Study. CC BY 4.0. Method and limits
Download chart (SVG)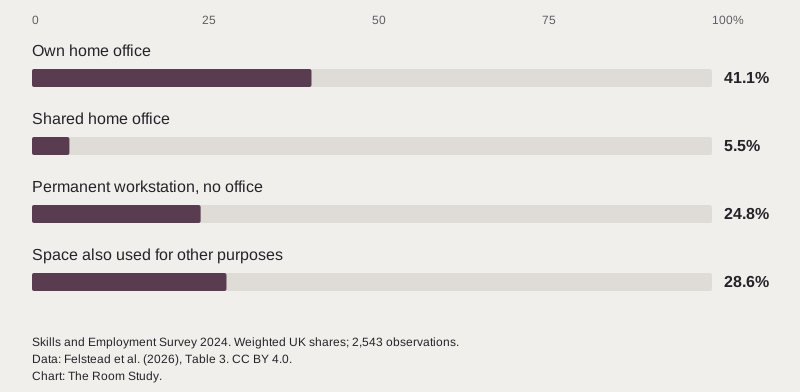
| Space reported | Share | What the category distinguishes |
|---|---|---|
| Own home office | 41.1% | An office of the respondent’s own |
| Shared home office | 5.5% | An office shared with another person |
| Permanent workstation, no office | 24.8% | A place set aside for work without a home office |
| Space also intended for other uses | 28.6% | Work takes place in space with another domestic purpose |
Who has a room of their own?
The same table reports a home office of their own for 47.8% of men working at home and 35.3% of women. These are separate group percentages. They do not tell us that a man and a woman in any particular household made a specific choice about who would occupy the spare room.
Still, the comparison is a reason to discuss a shared home’s working arrangements explicitly. Compare the hours, calls, equipment and privacy each person needs. A room allocated during a temporary arrangement may be worth reviewing as those demands change. The figures cannot decide which person should get the quieter space.
Plan the change from work to home
For a surface that does two jobs, draw both states. Include the monitor, keyboard, papers and chair during work, then show where each goes when the room returns to meals or relaxation. Measure the stored equipment as carefully as the desktop. A laptop can close while its cables, charger and second screen still occupy the room.
For a permanent corner, look at how the desk joins the rest of the room. Check the chair pulled back, the route past it and what remains in view from the sofa or bed. These checks make the space commitment concrete; they are editorial planning suggestions, not interventions evaluated in this survey.
Start with the work the room must hold
I would write a brief around a normal working day before choosing an office style. Include activities that need quiet, items that must remain secure, and the point when the room needs to serve someone else. That gives a compact desk or a folding arrangement a job to meet, rather than judging it only by how little space it occupies.
The survey measures what workers report using. It does not certify the comfort, accessibility or suitability of any particular arrangement, and its workspace percentages do not demonstrate that changing a room causes higher productivity. The practical value is in recognising the arrangement you have and the trade-offs it asks you to manage.
Methodology & sources
Felstead and colleagues published this analysis on 24 February 2026. We use Table 3 of the published paper, checked on 18 October 2026. It combines British face-to-face and online interviews with Northern Ireland online interviews, with weights applied. This is the UK table, distinct from the British-only historical series elsewhere in the paper.
Survey eligibility was paid work and age 20–65 inclusive. The 2024 collection included 2,824 British face-to-face interviews and 2,645 online interviews. Table 3 lists 1,084, 140, 575 and 744 observations by space type, totalling 2,543. Those unweighted counts are not the proportions used to construct the chart: we retain the published weighted percentages.
Work-location questions identify the main workplace and other places used for at least the equivalent of a full day during the previous seven days. A follow-on question records four types of space within the home. Table 3 does not supply confidence intervals for these categories or separate counts for the male and female rows. We make no new significance tests or causal claims.
The source is licensed CC BY 4.0. Attribution: Alan Felstead, Rhys Davies, Duncan Gallie, Francis Green, Golo Henseke and Ying Zhou, Industrial Relations Journal, DOI 10.1111/irj.70032. The chart is our presentation of their published Table 3 values.
We review these resources when the underlying releases change. A review date does not make a figure expire: its measurement period stays visible until a checked revision replaces it.
The Spatial Anatomy of Working at Home: Concepts, Measures and Types of Spaces Used
- Publisher
- Alan Felstead, Rhys Davies, Duncan Gallie, Francis Green, Golo Henseke and Ying Zhou; Industrial Relations Journal
- Release
- 2026-02-24. Published article, DOI 10.1111/irj.70032. Table 3 uses the combined UK 2024 sample; the historical series elsewhere in the article uses British face-to-face interviews and is not used here.
- Coverage
- United Kingdom. People in paid work aged 20 to 65. The selected table covers those working at home who answered the workspace question.. 2024 Skills and Employment Survey; research published in 2026.
- Method
- Stratified probability sampling for the British face-to-face survey; up to two eligible people per household in 2024. Online versions invited up to two eligible respondents per household, with self-selection within households. Table 3 combines modes and applies survey weights. The 2024 survey comprised 2,824 British face-to-face interviews and 2,645 online interviews across Britain and Northern Ireland. Table 3 reports 1,084, 140, 575 and 744 observations in its four workspace categories: 2,543 in total..
- Reuse
- Creative Commons Attribution 4.0. Selected table values reproduced with attribution; chart and editorial interpretation by The Room Study. Source reuse information
Published paper (PDF) · Cardiff University repository and licence · Journal record
Cite this research
Credit the original source when using its estimates. For our derived comparisons, credit The Room Study analysis and retain the population and dates.
The Room Study (2026). Where working from home actually fits. Published 18 October 2026. https://theroomstudy.com/statistics/uk-working-from-home-space. Based on Alan Felstead, Rhys Davies, Duncan Gallie, Francis Green, Golo Henseke and Ying Zhou; Industrial Relations Journal data; measurement period: 2024 survey; research published February 2026.
CSV: source estimates and The Room Study calculations. Please keep the source attribution and methodological notes with any reuse.