
Living alone in the UK: how many homes are for one?
United Kingdom · 2025, compared with 2015
An estimated 8.6 million people lived alone in the UK in 2025. Their homes accounted for 29.5% of all households. That is a substantial audience for rooms arranged around one person’s ordinary day, whether there is space for a dining table or just a good chair by the window.
By The Room Study · Published
Data: 2025, compared with 2015 · Sources checked 22 October 2026
Key findings
An estimated 8.57 million people aged 16 or over lived alone in the UK in 2025, rounded to 8.6 million in the ONS bulletin. Source
Link to finding
Does nearly a third of the UK live alone?
No. The 29.5% figure describes households. A household with one resident contributes one household to the total, just as a household with several residents does. It cannot be read as the share of the population living alone.
For an interiors reader, the distinction matters. The figure tells us how common this arrangement is among homes; it tells us nothing about their floor area or the furniture inside. One person may have a box room, a flat or a whole house to arrange.
Is living alone becoming more common?
The estimated number rose from 7.7 million in 2015 to 8.6 million in 2025. As a share of households, the figures were much closer: 28.6% and 29.5%. ONS describes the proportion as similar to ten years earlier and says the increase was not statistically significant after allowing for population growth.
The chart uses the household percentages so a bigger population does not get mistaken for a dramatic change in how people live. Both bars start at zero. The table keeps the population estimates alongside them, with their different units clearly labelled.
One-person households: a similar share over the decade
Percentage of all UK households, using the ONS 2025 dataset edition

Data: Office for National Statistics, Families and households in the UK: 2025, section 3; Table 5. Chart: The Room Study. Percentages describe households, not the population. ONS describes the proportion as similar across the decade. Method and limits
Download chart (SVG)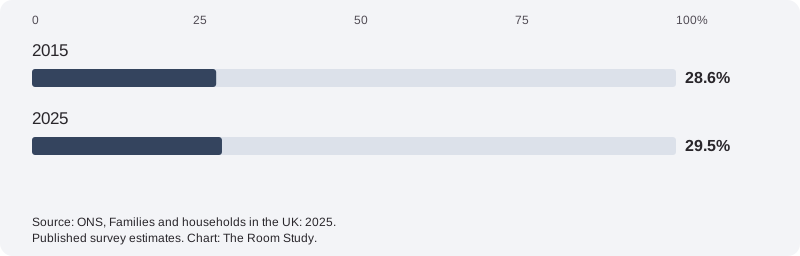
| Measure | 2015 | 2025 | Who is counted |
|---|---|---|---|
| People living alone | 7.743 million | 8.570 million | People aged 16 or over in one-person households; survey estimates rounded to the nearest thousand |
| One-person share of households | 28.6% | 29.5% | All UK households |
| Share aged 65 or over among people living alone | 46.9% | 49.6% | People aged 16 or over who live alone |
Who are these homes for?
Almost half of the people living alone in 2025 were aged 65 or over: 49.6%, compared with 46.9% in 2015. That describes the age mix within the group living alone. It does not mean half of all older people live alone.
There is no single design brief hiding inside that age profile. A reader who has lived in the same house for years may want to change very little. Someone furnishing a first flat may be starting with a mattress and several boxes. Those are possible briefs, not households observed by this research.
Living alone tells us who shares the home
These figures do not measure loneliness, how often someone has visitors or whether they are in a relationship. A household count cannot tell us how an evening feels. Our illustrated story, Room for one, explores one imagined evening; it is a companion to the evidence, not a description of everyone in it.
When thinking about a room for one, begin with what happens there most days. Where do you like to eat? What needs to be within reach of the chair? How much space should remain ready for guests? The answers are more useful for arranging furniture than assuming that living alone requires a particular style.
Methodology & sources
ONS published these estimates on 17 April 2026, using the April to June Labour Force Survey. The 2025 achieved sample was 33,235 households, including imputed households. Most communal establishments are excluded; students in halls are included through their parental home. Lower achieved samples in recent years have increased uncertainty.
We checked the original bulletin and downloaded workbook on 22 October 2026. Table 5 supplies household counts; Table 6 supplies people living alone and their age groups. Both comparison years come from this edition. The workbook gives counts in rounded thousands, while the bulletin calculates percentages from unrounded estimates.
Ratios calculated from the public workbook cells reproduce all four selected percentages to one decimal place. We retain the official percentages and ONS interpretation of change. This is an arithmetic cross-check, not a reconstruction from survey microdata or a new significance test. The 2025 count has a published 95% confidence interval half-width of 206,000 people.
We review these resources when the underlying releases change. A review date does not make a figure expire: its measurement period stays visible until a checked revision replaces it.
Families and households in the UK: 2025; Families and households dataset, Tables 5 and 6
- Publisher
- Office for National Statistics
- Release
- 2026-04-17. 2025 edition checked against the original source workbook on 22 October 2026. All historical comparisons use the 2015 estimates in this same edition. Workbook counts are rounded thousands; published bulletin percentages are retained.
- Coverage
- United Kingdom. UK households; Table 6 covers people aged 16 or over living alone. Most communal establishments are excluded. Students in halls are included through their parental home.. April to June 2025 Labour Force Survey; comparison with April to June 2015.
- Method
- ONS weighted estimates from the April to June Labour Force Survey. Household definitions are consistent for the selected 2015 and 2025 comparison. The workbook supplies count estimates, coefficients of variation and 95% confidence intervals. Lower achieved sample sizes in recent years have increased uncertainty. The Quarter 2 2025 Labour Force Survey achieved 33,235 households, including imputed households. This is the whole achieved sample, not the sample of people living alone. Selected subgroup sample counts are not supplied in Tables 5 and 6..
- Reuse
- Open Government Licence v3.0. Contains public sector information licensed under the Open Government Licence v3.0. Chart and editorial explanation by The Room Study. Source reuse information
ONS statistical bulletin, 17 April 2026 · Families and households dataset and previous versions · 2025 source workbook: Tables 5 and 6 (XLSX)
Cite this research
Credit the original source when using its estimates. For our derived comparisons, credit The Room Study analysis and retain the population and dates.
The Room Study (2026). Living alone in the UK: how many homes are for one?. Published 22 October 2026. https://theroomstudy.com/statistics/uk-living-alone. Based on Office for National Statistics data; measurement period: 2025, compared with 2015.
CSV: source estimates and The Room Study calculations. Please keep the source attribution and methodological notes with any reuse.