
Young adults living with parents: the US picture
United States · 2025 survey · 2019 and 2022 context
Nearly half of Americans aged 18–29 lived with a parent in 2025. Yet the broad figure conceals a very different picture in the early and late twenties. Our analysis of Federal Reserve data separates those ages, with a chart, sample counts and calculations you can check.
By The Room Study · Published
Data: 2025 survey · 2019 and 2022 context · Sources checked 14 October 2026
Key findings
49% of US adults aged 18–29 lived with a parent in 2025, according to the Federal Reserve. Source
Link to findingAbout 65% of US adults aged 18–24 lived with a parent in 2025, in The Room Study’s weighted analysis of the same survey. Source
Link to findingAbout 32% of US adults aged 25–29 lived with a parent in 2025, in The Room Study’s weighted analysis of the same survey. Source
Link to findingAbout 18% of US adults aged 30–34 lived with a parent in 2025, in The Room Study’s weighted analysis of the same survey. Source
Link to finding
What does “living with parents” actually mean?
The Federal Reserve asks adults which people currently live with them, including a parent. It counts people who share a home; it does not establish who owns it, who pays the bills, or who moved in with whom.
That matters when the figures become a story about children who never left home. Some may have stayed, some may have returned, and some may be housing a parent themselves. This question cannot distinguish those histories. A family sharing an address is not, by itself, evidence of financial dependence or an unhappy arrangement.
The twenties are two different stories
In our calculation, 64.5% of 18–24-year-olds lived with a parent, compared with 32.3% of those aged 25–29. The estimate was 18.2% at ages 30–34 and 10.5% at 35–44. A single “young adults” figure depends heavily on where the age boundaries are drawn.
These are different age groups observed in the same survey, not the same people followed as they grow older. The chart cannot tell us the age at which someone will leave home. Each bar uses all respondents in its own age band as the denominator.
Living with a parent, by age
United States, 2025 · share of adults within each age band

The Room Study weighted calculations from Federal Reserve SHED 2025 public-use data. Point estimates, rounded to one decimal; no subgroup significance test. Method and limits
Download chart (SVG)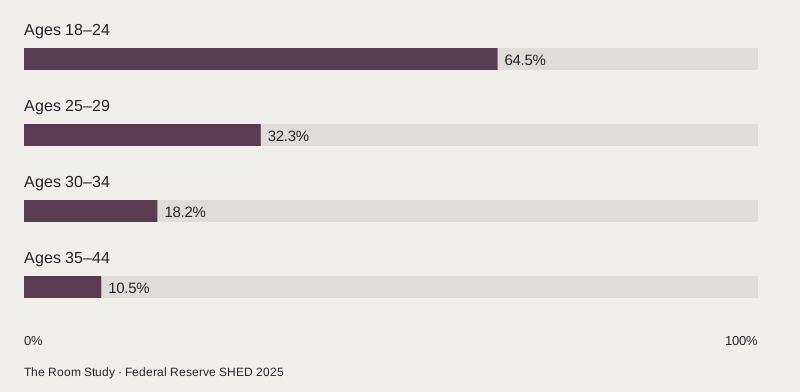
| Age group | Living with a parent | Survey respondents |
|---|---|---|
| 18–24 | 64.5% | 1,000 |
| 25–29 | 32.3% | 1,091 |
| 30–34 | 18.2% | 795 |
| 35–44 | 10.5% | 2,207 |
| 18–29 (headline group) | 49.2% | 2,091 |
Has living together become more common?
For adults under 30, the Federal Reserve reports a rise from 37% in 2019 to 43% in 2022 and 49% in 2025. Those are rounded survey estimates. The published increase since 2019 is twelve percentage points.
Our checks of the public files reproduce those rounded figures. The 2019 file contains refused answers, while the current 2022 and 2025 files include imputed responses. Retaining or excluding the 2019 refusals from the denominator still rounds to 37% for ages 18–29. These observations describe a change in prevalence; they do not establish what caused it.
Why might another source give a different US figure?
The Census Bureau’s separate 2025 Current Population Survey release puts the share of 18–24-year-olds living in their parental home at 58%. That differs from the 64.5% in our SHED calculation. We have not reconciled the difference, and do not select one as the definitive answer for every purpose.
This page uses SHED consistently for its US chart and trend. If you are working with a Census series, keep its figures and definitions together instead of substituting ours. Naming the survey is part of citing the number accurately.
The UK figure answers a different question
The Office for National Statistics estimates that 28.7% of UK 20–34-year-olds lived with their parents in 2025, compared with 25.4% in 2015. Its definition excludes people who live with a partner or have a child of their own, even if they remain in the same household as their parents.
There are other differences: the age range is wider than the US headline group, “parent” can include a grandparent or stepparent, and students in halls are counted through their parental homes. The UK number belongs beside its own definition. It is not a like-for-like score against the US figure.
A family home may need to work for several adults
A bedroom can remain someone’s main room well into adulthood. For a household living this way, it is worth asking whether there is somewhere to take a private call, work without occupying the dining table, or go to bed while someone else watches television. Those are practical questions about the particular home, rather than preferences measured by this survey.
The numbers offer context for that conversation. They do not show that an extension is needed, that the home is overcrowded, or that every family wants more separation. Understanding who uses each room, and at what time, should come before deciding which wall to remove.
Methodology & sources
The age-band analysis uses the Federal Reserve’s 2025 SHED public-use file: ppage for age, L0_d for whether a parent lives with the respondent, and weight for the cross-sectional survey weight. For each band, we divide the sum of weights for Yes responses by the sum for Yes and No responses, then multiply by 100. A second implementation independently reproduced the results.
All 12,934 records have a Yes or No value for this item in the current 2025 file. We retain the publisher’s imputed responses. The 18–29 group includes 20 imputed answers among 2,091 respondents; excluding them changes its estimate from 49.17% to 49.40%. This sensitivity check is not a confidence interval.
Sample counts are unweighted respondent counts, not population totals or the denominators used in the percentage calculation. The 18–29 row overlaps the first two rows and must not be added to them. Weighted percentages also cannot be averaged without their weighted denominators.
These are survey point estimates, subject to sampling, non-response, coverage and imputation error. We have not calculated subgroup confidence intervals or tested the differences for statistical significance. One decimal place helps reproduce the calculation; it is not a claim of that degree of population precision.
The separate UK figures are published ONS estimates, not our recalculation. They use a different age range and parental-family definition, so we do not combine them with SHED. Recent smaller Labour Force Survey samples increase uncertainty. Other US surveys, including the Census Current Population Survey, also use different questions and classification rules; do not join their figures to this SHED series.
The downloadable CSV contains only our 2025 US aggregate results, weighted sums, sample counts, imputation sensitivity and source-file checksum. It contains no individual survey records. The accompanying Python script uses only the standard library and requires the original public2025.csv from the Federal Reserve data page. Historical and UK context are excluded from that download to keep its population and calculation consistent.
We review these resources when the underlying releases change. A review date does not make a figure expire: its measurement period stays visible until a checked revision replaces it.
Economic Well-Being of U.S. Households in 2025: living arrangements
- Publisher
- Federal Reserve Board
- Release
- 26 May 2026. Public data version updated 7 July 2026; codebook updated 4 September 2026. Downloaded 14 October 2026.
- Coverage
- United States. Civilian, noninstitutionalised adults aged 18 and over; age groups specified beside each estimate. 17–28 October 2025.
- Method
- Survey of Household Economics and Decisionmaking (SHED), an online probability-panel survey administered by Ipsos. Cross-sectional post-stratification weights; imputed answers retained. 12,934 retained respondents; age-band sample counts accompany our table.
- Reuse
- Federal Reserve public-use data. Cite the Board for the survey and The Room Study for these derived age-band tabulations. No individual survey records are redistributed here.
Public data and revisions · 2025 codebook · Survey methodology · Reproduce our calculations (Python)
Families and households in the UK: 2025
- Publisher
- Office for National Statistics
- Release
- 17 April 2026. Bulletin and definition notes checked 14 October 2026.
- Coverage
- United Kingdom. People aged 20–34 living in households, under the ONS parental-family definition. April–June 2025; 2015 comparison.
- Method
- Labour Force Survey household estimates. A person living with a partner or with a child of their own is classified as a separate family, even within the parental household. Recent lower achieved sample sizes increase uncertainty; consult the accompanying ONS quality measures.
- Reuse
- ONS content reused under the Open Government Licence v3.0. Source reuse information
America’s Families and Living Arrangements: 2025 release
- Publisher
- U.S. Census Bureau
- Release
- 2 December 2025. Used only to identify a separate official estimate, not combined with the SHED calculations.
- Coverage
- United States. Adults aged 18–24 in the release’s parental-home estimate. 2025.
- Method
- Current Population Survey Annual Social and Economic Supplement (CPS ASEC). Sampling and nonsampling error information is in the original CPS technical documentation.
- Reuse
- US Census public statistical release; retain attribution.
Adult living-arrangements tables · CPS 2025 technical documentation
Cite this research
Credit the original source when using its estimates. For our derived comparisons, credit The Room Study analysis and retain the population and dates.
The Room Study (2026). Young adults living with parents: the US picture. Published 15 October 2026. https://theroomstudy.com/statistics/young-adults-living-with-parents. Based on Federal Reserve Board and Office for National Statistics and U.S. Census Bureau data; measurement period: 2025 survey · 2019 and 2022 context.
CSV: source estimates and The Room Study calculations. Please keep the source attribution and methodological notes with any reuse.