
The cost of a comfortable home: U.S. energy insecurity
United States · 2024 survey; preliminary release March 2026
A home can have heating and still be difficult to keep comfortable. In the 2024 U.S. energy survey, almost one in three households reported at least one of the energy-hardship experiences measured by the survey. Renters faced a particularly high rate. Here is what those figures measure, and how to put your own bills in context.
By The Room Study · Published
Data: 2024 survey; preliminary release March 2026 · Sources checked 23 October 2026
Key findings
32.9% of U.S. households experienced at least one form of energy insecurity measured in the 2024 RECS, an estimated 43.56 million households. Source
Link to finding47.8% of renter households reported energy insecurity, compared with 25.7% of owner-occupying households. Source
Link to finding24.8% of households reduced or went without basic necessities, such as food or medicine, to pay an energy bill. Source
Link to finding
When the bill changes how you live
Energy insecurity describes experiences, rather than one universal bill threshold. The survey asks about cutting back on necessities, keeping a home at an unsafe or unhealthy temperature, notices about supply, and being unable to use heating or cooling equipment.
These experiences can occur together. A notice is not a completed disconnection. The temperature question means keeping the home at a temperature the respondent felt was unsafe or unhealthy; it does not mean moving out of the home.
Nearly half of renter households
The estimated share was 47.8% among renters and 25.7% among owners. Each percentage uses its own tenure group as the denominator, so this is a comparison of prevalence rather than the number of homes in each group.
The gap is descriptive. Income, building condition, location and other circumstances differ between households; these figures cannot tell us how much of the difference renting itself explains.
Energy insecurity by housing tenure
Share reporting at least one measured experience, 2024 RECS. Separate denominators; all households includes both tenure groups.

Source: EIA, 2024 RECS, preliminary HC11.1. The Room Study percentages from published rounded counts. Rented includes occupancy without rent. Method and limits
Download chart (SVG)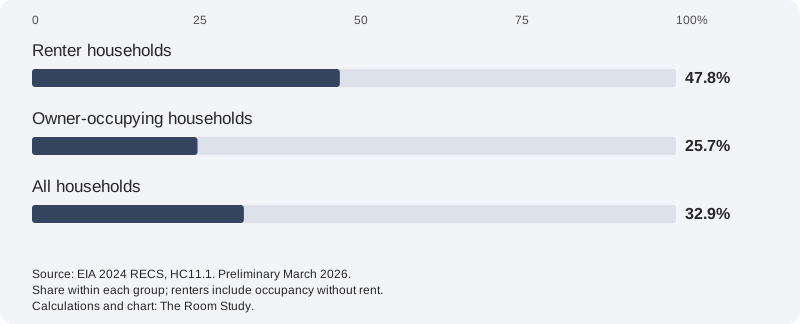
| Measure | Affected households (millions) | Denominator (millions) | Share |
|---|---|---|---|
| Any energy insecurity | 43.56 | 132.54 | 32.9% |
| Any: renter households | 20.55 | 43.00 | 47.8% |
| Any: owner-occupying households | 23.01 | 89.54 | 25.7% |
| Reduced basic necessities | 32.89 | 132.54 | 24.8% |
| Kept home at unsafe/unhealthy temperature | 17.55 | 132.54 | 13.2% |
| Disconnect / delivery-stop notice | 16.19 | 132.54 | 12.2% |
| Unable to use main heating equipment | 6.83 | 132.54 | 5.2% |
| Unable to use air conditioning | 8.16 | 132.54 | 6.2% |
Start with a year, not the worst month
For your own home, a full year of bills gives a more useful starting point than one winter or summer payment. Keep the period consistent with your income, and separate home energy from unrelated utilities. A lower monthly payment on a budget plan may spread the cost without reducing annual use.
The calculator below describes the share of income going on energy. It does not reproduce the survey result or decide whether your home is comfortable. Two households spending the same share can have very different temperatures, equipment and needs.
Useful routes when comfort is out of reach
If the bill is the immediate problem, the official USAGov energy-assistance page links to state LIHEAP offices and crisis support. Weatherisation assistance addresses eligible home improvements; application rules and available help vary by location. Renters can also ask their landlord about equipment or building defects rather than assuming every comfort problem is theirs to solve.
A new throw or curtain can change how a room feels. It is not a substitute for working equipment, an affordable bill or the repairs a building needs. We do not attach a promised energy saving to a decorative purchase.
What share of your income goes on home energy?
Use a full year of electricity, gas and other household fuel spending, plus household income before tax for the same year. Leave out water, phone and internet bills. If energy is included in rent and you cannot separate it, this calculation will not represent your full costs.
Your amounts stay in this page. This tool does not send, store or track them.
Methodology & sources
We divide each published affected-household count by the matching total, then multiply by 100: 43.56 ÷ 132.54 × 100 = 32.9% nationally; 20.55 ÷ 43.00 × 100 = 47.8% for renters; 23.01 ÷ 89.54 × 100 = 25.7% for owners. Inputs are already rounded to hundredths of a million, so extra decimal places would imply unsupported precision.
This preliminary release reports 2024 RECS household characteristics collected from October 2024 to April 2025. Hardship questions concern the previous 12 months at interview, not a uniform calendar-year diary. Equipment questions include unaffordable repairs or energy-supply disruption caused by non-payment. Categories overlap and must not be added.
Question SCALEG resolves the table’s abbreviated temperature label: respondents were asked about keeping the home at a temperature they felt was unsafe or unhealthy. This item does not ask why. These are reported experiences, not measured indoor temperatures or a clinical assessment. The necessities question gives food and medicine as examples, rather than restricting the response to those two expenses.
Estimates have sampling and non-sampling uncertainty. HC11.1 supplies relative standard errors for published counts; we have not constructed confidence intervals for these ratios or tested the renter–owner difference. The chart is descriptive.
The private calculator uses annual home energy spending ÷ annual household income before tax × 100. Monthly equivalent is annual spending ÷ 12. It accepts a zero energy bill and positive income, retains no entered data and applies no hardship cut-off.
We review these resources when the underlying releases change. A review date does not make a figure expire: its measurement period stays visible until a checked revision replaces it.
2024 Residential Energy Consumption Survey: household energy insecurity (HC11.1)
- Publisher
- U.S. Energy Information Administration
- Release
- March 2026. Preliminary housing-characteristics release; not a 2026 measurement. Source table and questionnaire checked on 23 October 2026.
- Coverage
- 50 U.S. states and the District of Columbia. Primary occupied housing units. Vacant, seasonal and second homes, military housing and group quarters are excluded. Rented includes occupancy without rent.. 2024 RECS; interviews October 2024 to April 2025; hardship questions refer to the preceding 12 months.
- Method
- Weighted household survey. Published counts are millions of housing units, rounded to two decimals. Percentages here divide the relevant published count by its matching denominator. 16,676 eligible household responses overall; item and tenure-specific unweighted response counts are not supplied in HC11.1. Relative standard errors are supplied for count estimates.
- Reuse
- Selected U.S. government aggregates reproduced with attribution. Calculations and charts by The Room Study; no individual survey records are distributed. Source reuse information
2024 data and release notes · Questionnaire (SCALEG) · 2024 survey methodology
Cite this research
Credit the original source when using its estimates. For our derived comparisons, credit The Room Study analysis and retain the population and dates.
The Room Study (2026). The cost of a comfortable home: U.S. energy insecurity. Published 23 October 2026. https://theroomstudy.com/statistics/us-home-energy-insecurity. Based on U.S. Energy Information Administration data; measurement period: 2024 survey; preliminary release March 2026.
CSV: source estimates and The Room Study calculations. Please keep the source attribution and methodological notes with any reuse.