
When home insurance becomes hard to afford
United States · 2025 survey; released May 2026
Having insurance and feeling able to afford the cover you want are different things. In the 2025 Federal Reserve survey, one in five insured homeowners wanted more coverage but said cost stood in the way. These figures help describe the pressure; they cannot assess an individual policy.
By The Room Study · Published
Data: 2025 survey; released May 2026 · Sources checked 23 October 2026
Key findings
20% of insured homeowners wanted more coverage but said they could not afford it in the 2025 Federal Reserve survey. Source
Link to finding6% of homeowners reported having no homeowners insurance. Source
Link to finding
What “more cover” tells us
The 20% figure captures a preference constrained by cost. It does not prove that one in five insured homes would receive an inadequate payout, or tell us how much extra cover those respondents wanted.
The separate question about struggling with premiums describes another experience. The same homeowner could report both; adding the two percentages would count some people twice.
Affordability among people who have insurance
Both bars below concern insured homeowners. Keeping that denominator visible matters: the separate figure for no insurance is measured among all homeowners, including those without cover.
The findings are national survey estimates. They do not provide a quotation for a particular home, a state league table or an explanation of any one renewal notice.
Two affordability pressures among insured homeowners
Share of insured U.S. adult homeowners, 2025 SHED. Responses may overlap.

Source: Federal Reserve, 2025 SHED, Housing chapter (May 2026). Published rounded percentages; insured homeowners only. Chart: The Room Study. Method and limits
Download chart (SVG)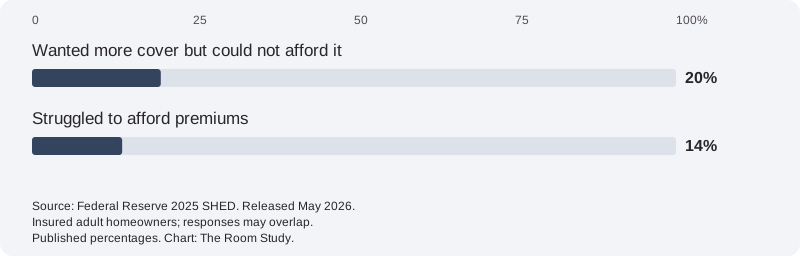
| Measure | Share | Population |
|---|---|---|
| Wanted more cover but could not afford it | 20% | Insured homeowners |
| Struggled to afford premiums | 14% | Insured homeowners |
| No homeowners insurance | 6% | All homeowners |
| No homeowners insurance: mortgage-free | 13% | Mortgage-free homeowners |
| No homeowners insurance: with mortgage | 3% | Homeowners with a mortgage |
A paid-off home still has costs
The uninsured share was 13% among mortgage-free homeowners and 3% among those with a mortgage. Mortgage lenders generally require cover, which is part of the context for the difference. The two groups also have different financial and personal circumstances.
For readers, the useful distinction is between the mortgage payment and the costs that continue around it. A home can be paid off while insurance, maintenance and other bills still need room in the budget.
Read the renewal alongside last year’s policy
First establish the change in dollars, then compare what the two documents actually cover. Check limits, deductibles, exclusions and the treatment of roof damage or replacement costs. Ask the insurer or a licensed agent to explain differences that are unclear; a smaller premium alone does not show that two policies are equivalent.
The renewal calculator below makes the arithmetic visible. It does not recommend cancelling cover, changing a deductible or accepting a particular policy. The National Association of Insurance Commissioners’ consumer guidance is a useful next stop for questions to ask.
What does your renewal change?
Compare two annual premiums for your own home. Check that the documents cover the same period. A lower price does not establish equivalent cover.
Your amounts stay in this page. This tool does not send, store or track them.
Methodology & sources
The Survey of Household Economics and Decisionmaking was fielded on 17–28 October 2025 through Ipsos’s probability-based KnowledgePanel. The final sample contained 12,934 adults and was weighted to represent U.S. adults age 18 and over. The selected housing items’ unweighted subgroup response counts and confidence intervals are not supplied in this chapter.
We retain the report’s whole-percent precision. The chart compares two affordability responses among insured adult homeowners; the all-homeowner uninsured rate is kept in the separate table. These are adults’ reported experiences, not a property census or insurer policy audit. The findings do not establish an actuarial coverage shortfall.
We make no new significance or causal claims. The mortgage-free and mortgaged groups differ in age, income and other characteristics; lenders generally require homeowners insurance. National estimates do not establish local availability or explain an individual premium change.
Calculator: annual difference = new annual premium − previous annual premium; percentage change = difference ÷ previous premium × 100, when the previous premium is greater than zero; monthly equivalent = annual amount ÷ 12. A zero previous premium has no defined percentage change. Installment fees, policy differences and future claims are outside this calculation. Inputs are processed only in this page and are not retained.
We review these resources when the underlying releases change. A review date does not make a figure expire: its measurement period stays visible until a checked revision replaces it.
Economic Well-Being of U.S. Households in 2025: Housing
- Publisher
- Board of Governors of the Federal Reserve System
- Release
- 26 May 2026. 2025 survey estimates. Released percentages retained at their published whole-percent precision.
- Coverage
- United States. Adults age 18 and over. Each figure uses its stated subgroup: renters, homeowners or insured homeowners. These are not counts of dwellings or insurance policies.. Survey fieldwork 17–28 October 2025; rent arrears refer to the preceding year.
- Method
- Survey of Household Economics and Decisionmaking (SHED), administered by Ipsos through a probability-based online panel and weighted to represent U.S. adults. 12,934 adult respondents after quality exclusions. Housing chapter does not publish unweighted response counts for the selected items.
- Reuse
- Selected Federal Reserve published aggregates reproduced with attribution. No respondent records or source illustrations are redistributed.
Cite this research
Credit the original source when using its estimates. For our derived comparisons, credit The Room Study analysis and retain the population and dates.
The Room Study (2026). When home insurance becomes hard to afford. Published 23 October 2026. https://theroomstudy.com/statistics/us-home-insurance-affordability. Based on Board of Governors of the Federal Reserve System data; measurement period: 2025 survey; released May 2026.
CSV: source estimates and The Room Study calculations. Please keep the source attribution and methodological notes with any reuse.