
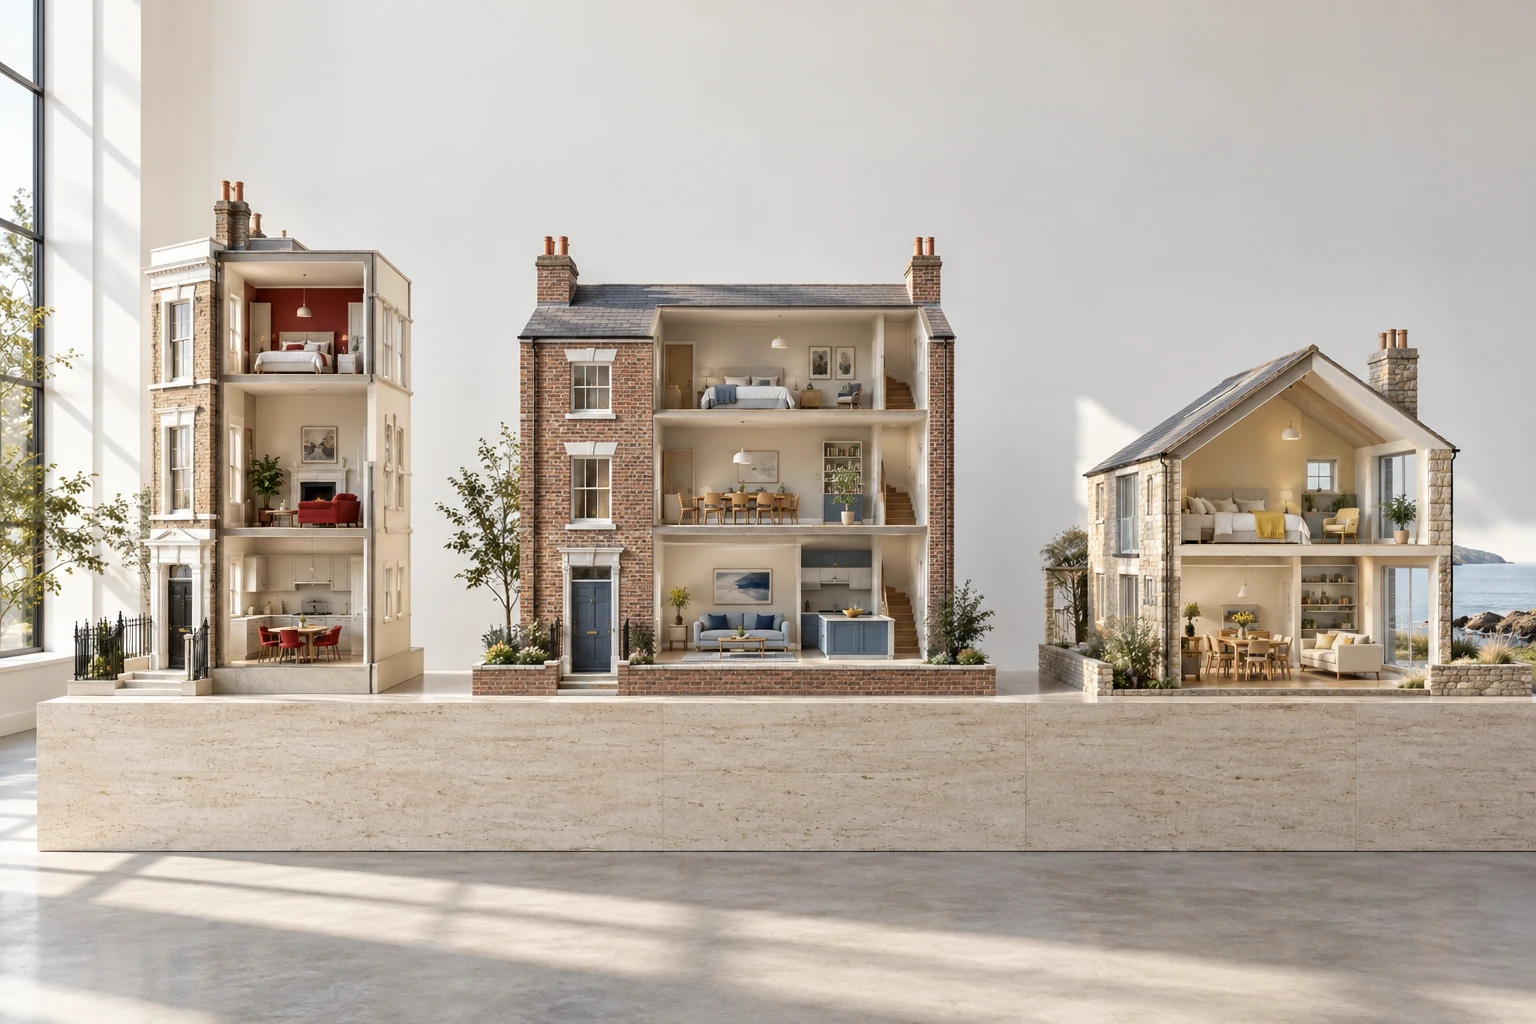
Half a million pounds ought to be a reasonably definite thing. Put it beside a home, however, and it becomes strangely elastic. In Camden, it falls short of the median flat. In Newcastle upon Tyne, it sits comfortably above the median detached house. The currency has remained obligingly consistent. The domestic possibilities have not.
Yet the latest migration figures show more moves from Newcastle to London than in the other direction. The price gap does not settle the decision. A home’s walls occupy one address; much of its usefulness exists somewhere else. Migration data
We compared official sale-price medians across every local authority in England and Wales, then followed the estimated moves between London and the rest of the UK from 2012 to 2025. The result is more interesting than a northern exodus. Northbound moves have increased, but most people leaving London for another UK region still go to the South East or East of England. And while the North gains from London among people in their thirties and forties, the traffic among those in their twenties runs strongly the other way. Housing data · Migration data
A budget with several addresses
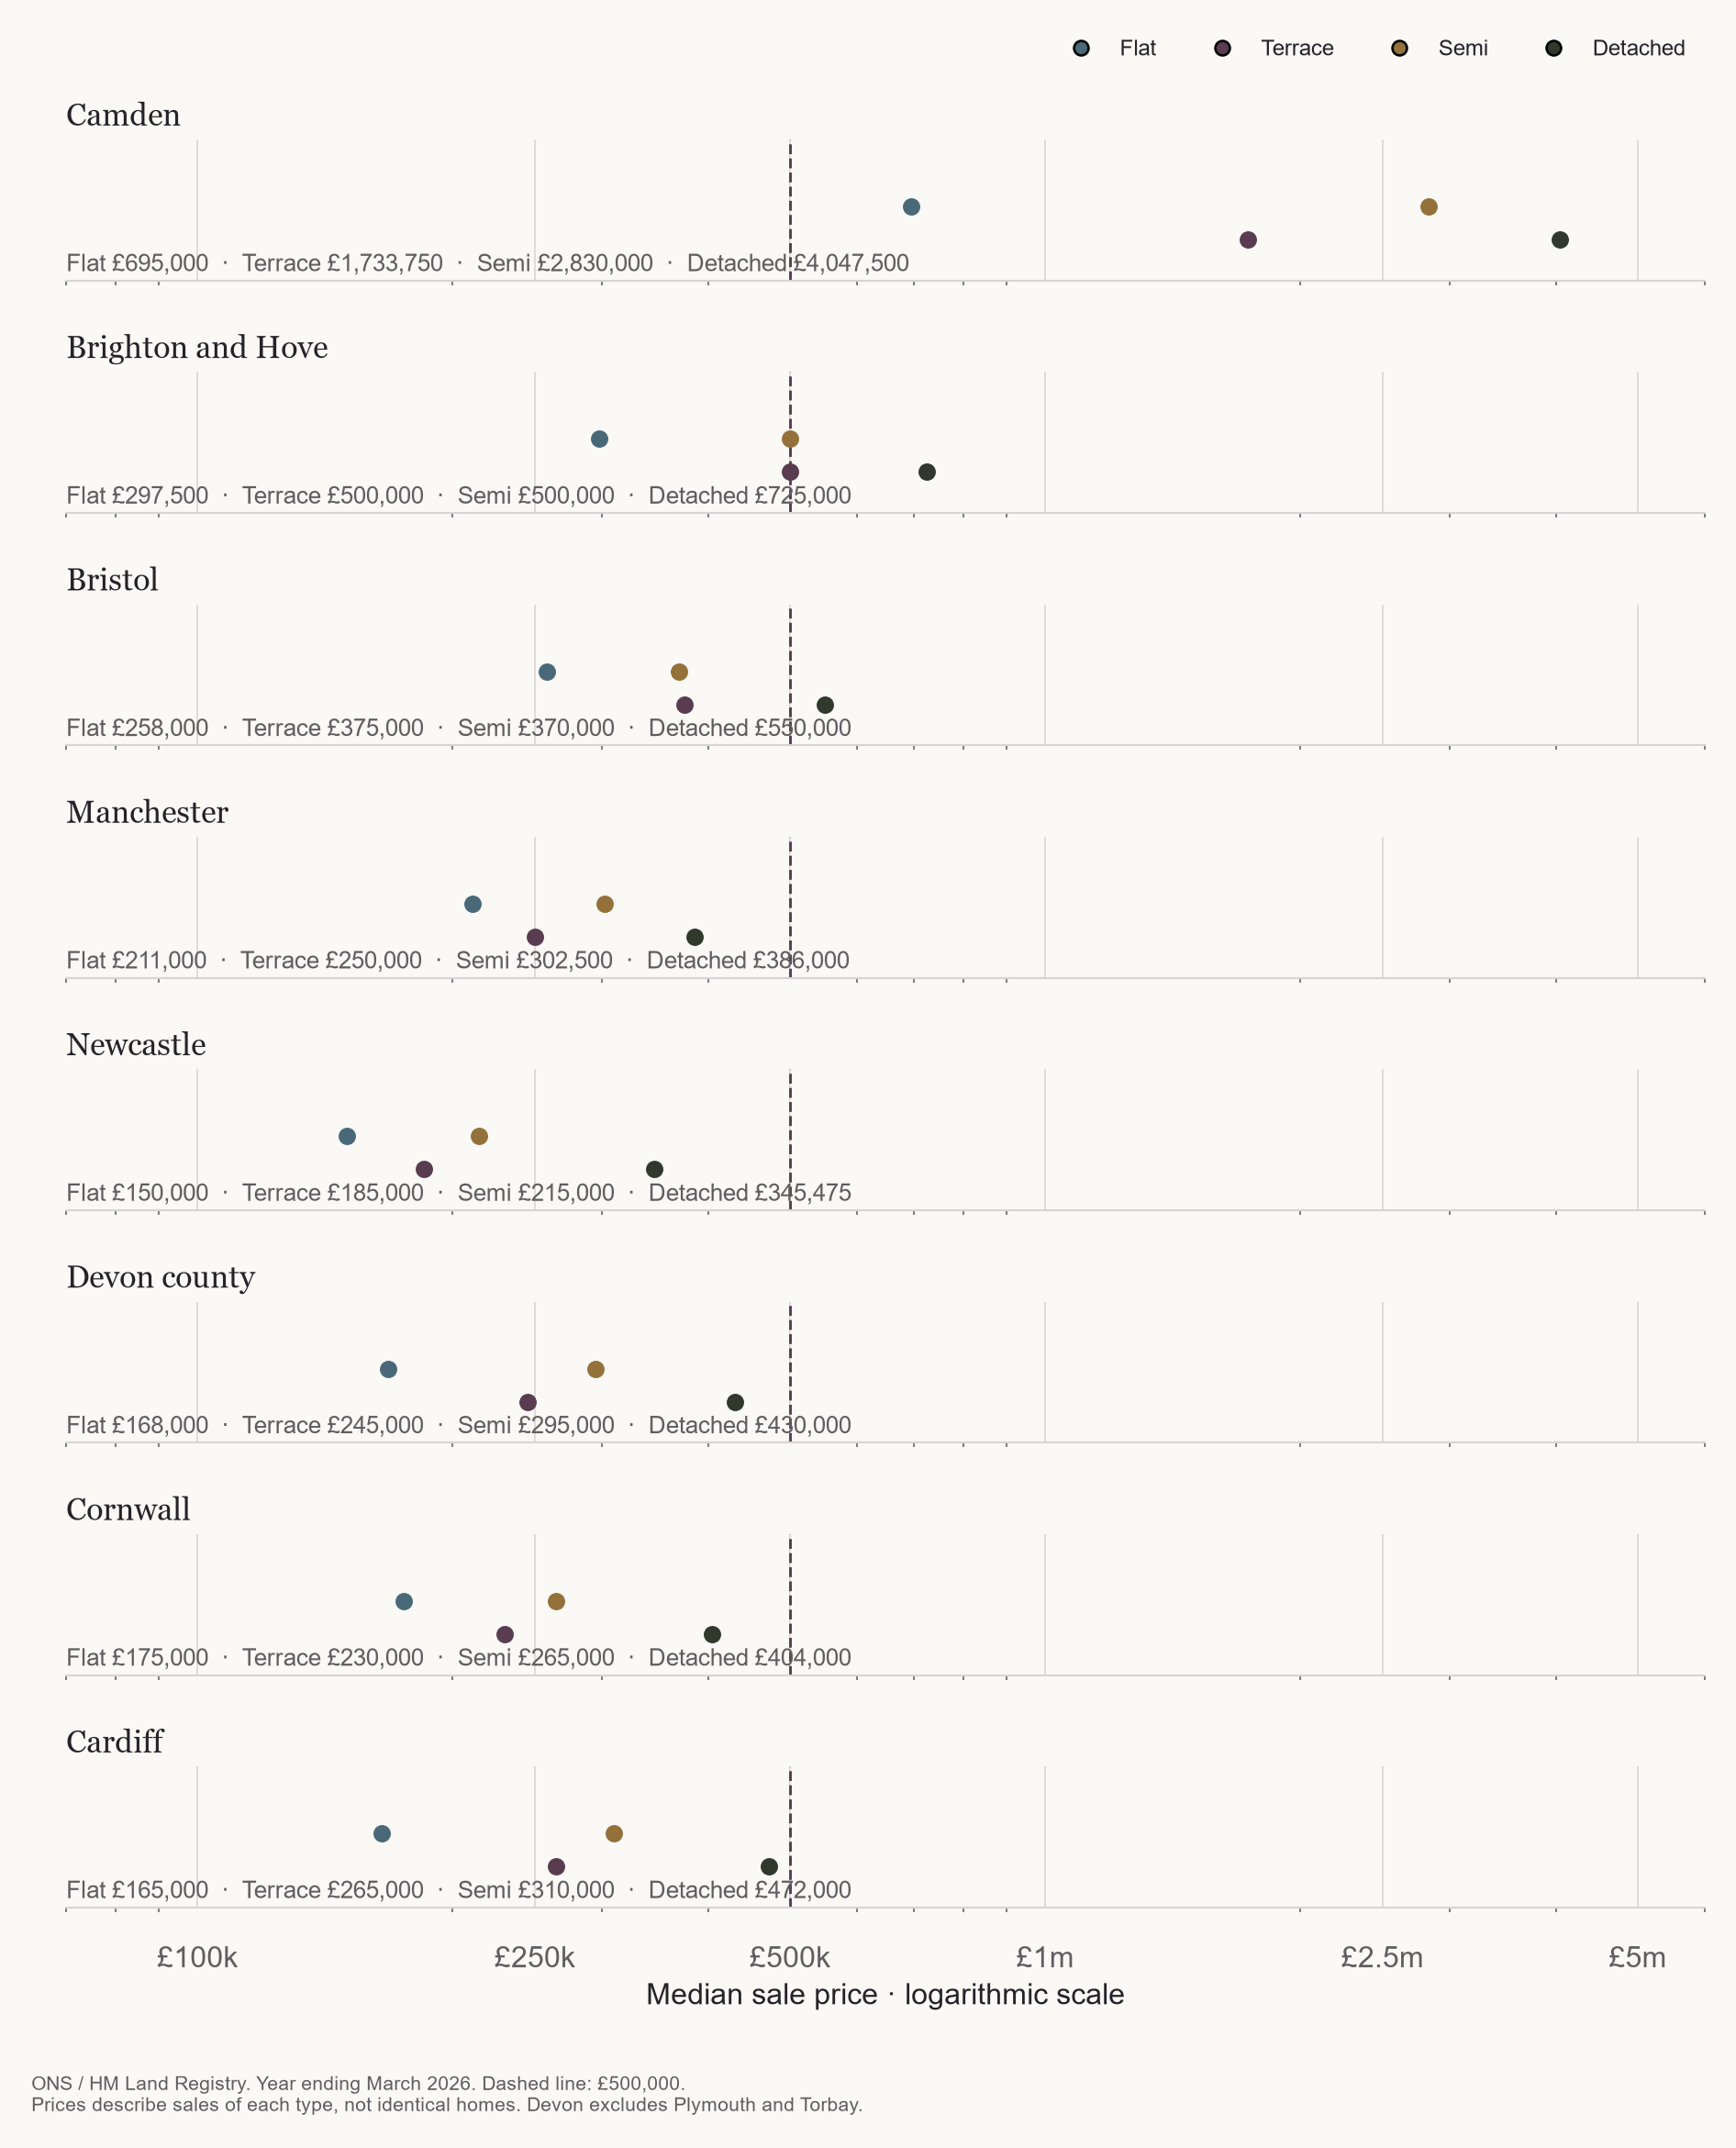
Start with the buildings. In the year ending March 2026, the median sale price of a flat in Camden was £695,000. In Croydon, the flat median was £280,000 and the terraced-house median £435,000. There is already more than one answer to the London question before anyone has left the capital.
Further along the map, £500,000 coincided with the median semi-detached and terraced sale price in Brighton and Hove. In Manchester and Newcastle, it sat above the detached median. The same budget has crossed into a different category of building.
These are prices for different collections of sold homes, not equivalent properties transported between cities. A category tells us something about domestic form, but nothing dependable about the number of bedrooms, the condition of the roof or the size of the kitchen. ONS property-type medians
How many kinds of home clear the £500,000 threshold?
Number of the four property-type medians at or below £500,000. Grey areas have fewer than 20 sales in at least one type. England and Wales, year ending March 2026.

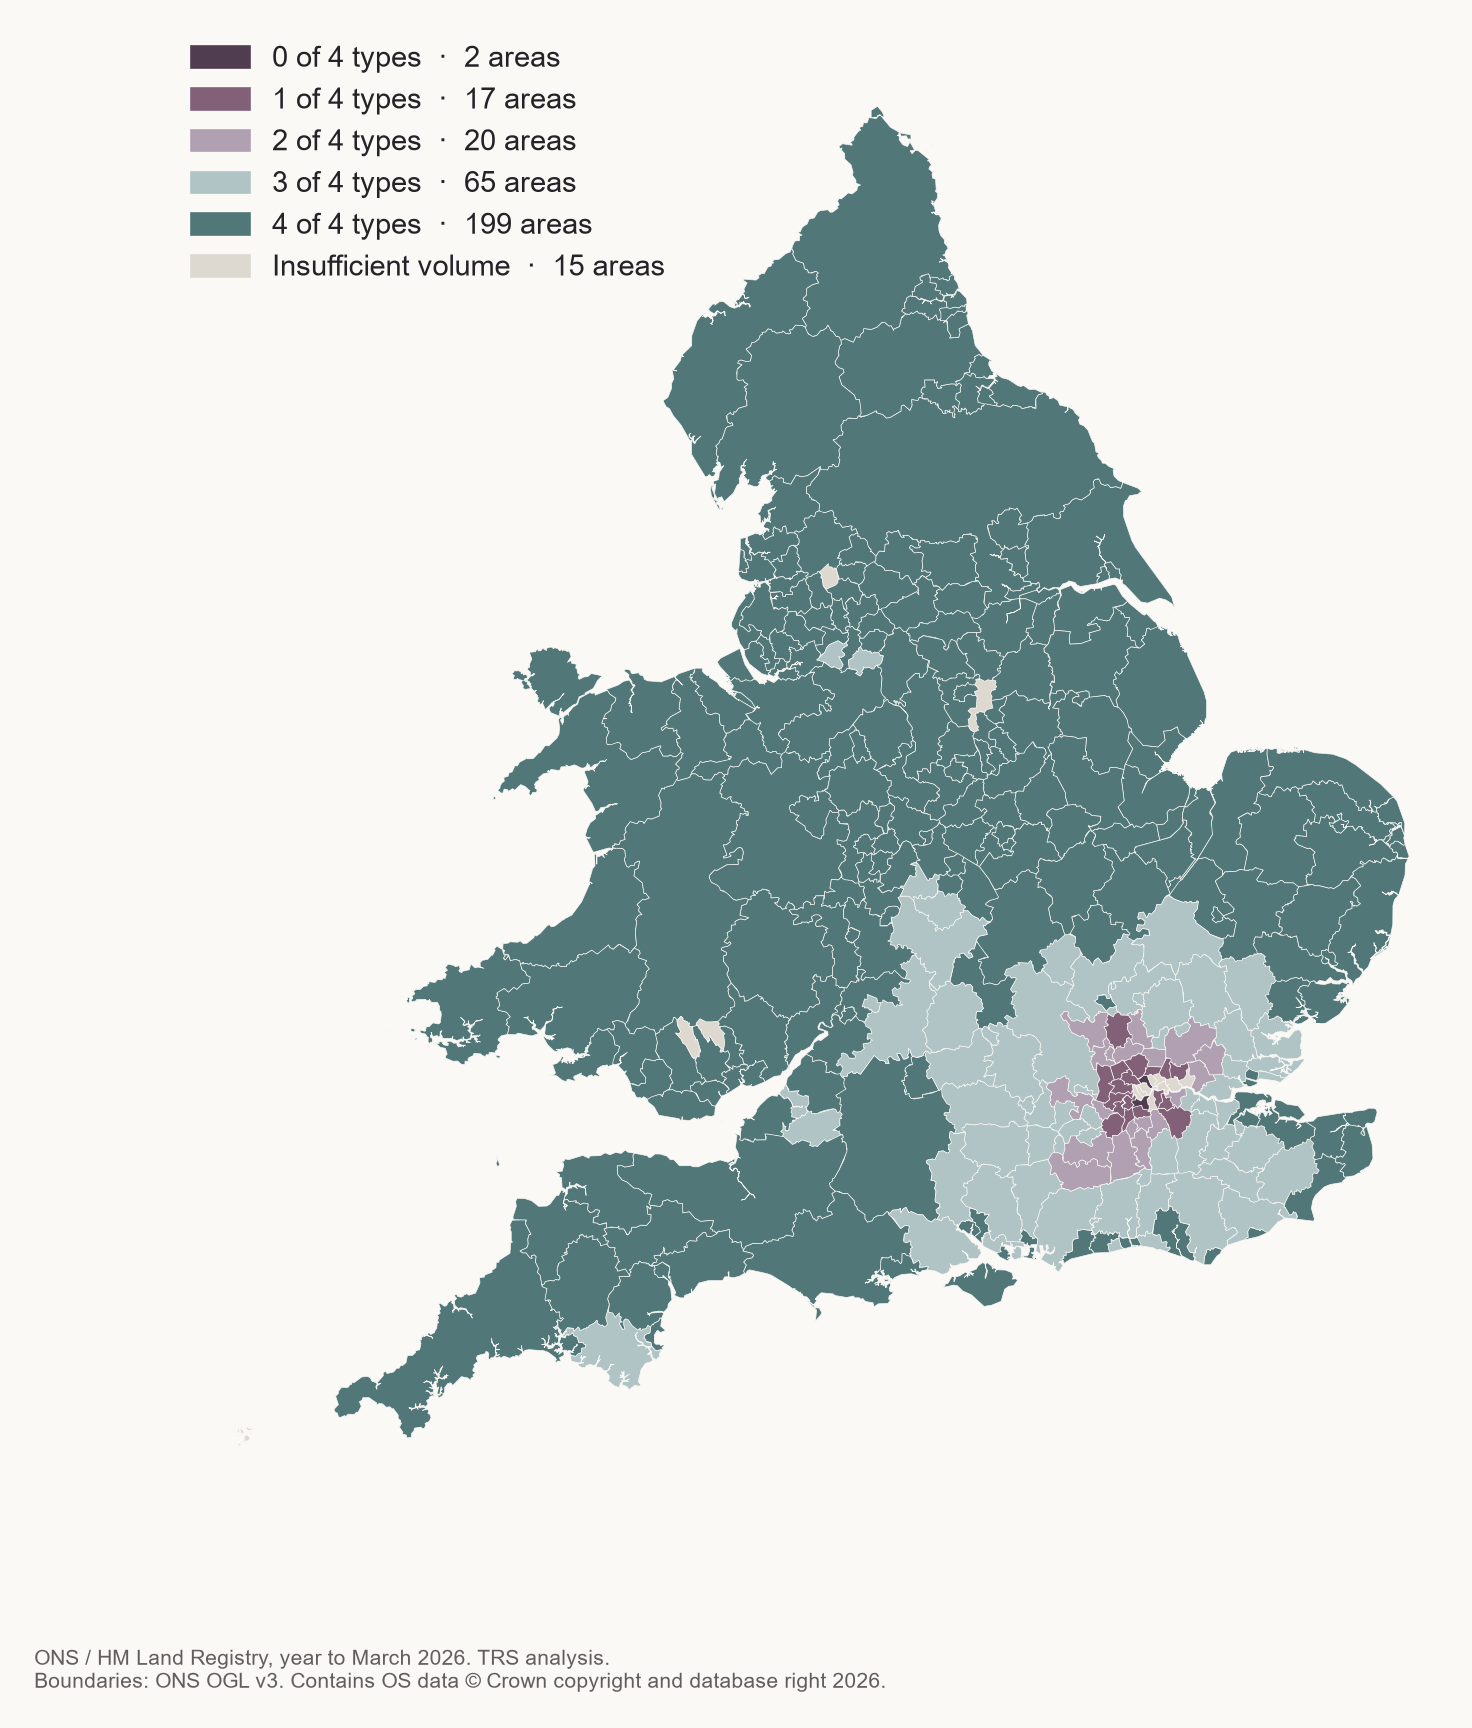
The map counts how many of the four property-type medians sit at or below £500,000. In 199 local authorities, all four do. That is a substantial geographical difference, though an area on a map is not a share of homes or people. Nor is a median a promise that a suitable property is currently for sale.
There is a reason we have resisted a tidy ladder from flat to terrace to semi to detached. Bristol’s terraced median is slightly higher than its semi-detached median. Eight authorities have at least one reversal of the usual price order in the published figures. Neighbourhoods, the mix of sales and small samples can matter as much as the label attached to the building. Where any type has fewer than 20 sales, we leave the map category unassigned. The full figures and counts remain available below.
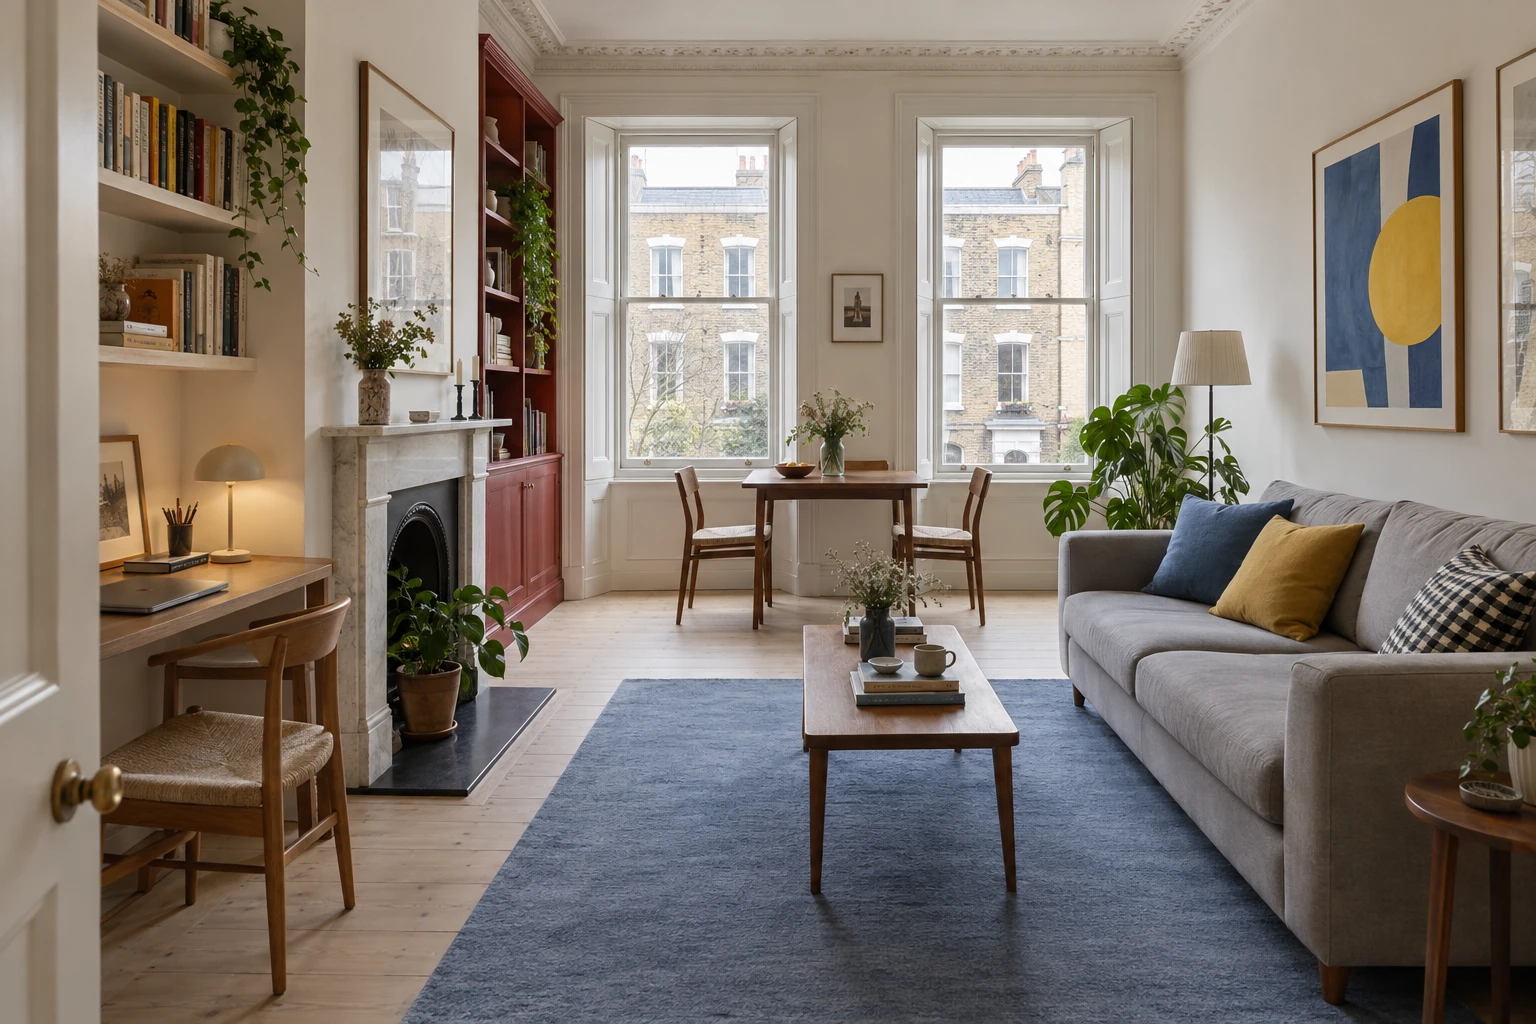
For an interiors reader, the possibility is not merely “more house”. It is the chance to stop asking one room to do quite so much. A dining table might remain a dining table through the working day. A visitor might have somewhere to sleep without the sitting room being dismantled. Those are imaginable uses of space, not measurements this dataset can make.
The same line. Eight different markets.
The dashed line marks £500,000 against all four medians. Common logarithmic scale; exact values in the table. Devon is the county excluding Plymouth and Torbay.

Camden
- Flat / maisonette
- £695,000Above £500k
- Terraced
- £1,733,750Above £500k
- Semi-detached
- £2,830,000Above £500k
- Detached
- £4,047,500Above £500k
Brighton and Hove
- Flat / maisonette
- £297,500At or below £500k
- Terraced
- £500,000At or below £500k
- Semi-detached
- £500,000At or below £500k
- Detached
- £725,000Above £500k
Bristol, City of
- Flat / maisonette
- £258,000At or below £500k
- Terraced
- £375,000At or below £500k
- Semi-detached
- £370,000At or below £500k
- Detached
- £550,000Above £500k
Manchester
- Flat / maisonette
- £211,000At or below £500k
- Terraced
- £250,000At or below £500k
- Semi-detached
- £302,500At or below £500k
- Detached
- £386,000At or below £500k
Newcastle upon Tyne
- Flat / maisonette
- £150,000At or below £500k
- Terraced
- £185,000At or below £500k
- Semi-detached
- £215,000At or below £500k
- Detached
- £345,475At or below £500k
Devon
- Flat / maisonette
- £168,000At or below £500k
- Terraced
- £245,000At or below £500k
- Semi-detached
- £295,000At or below £500k
- Detached
- £430,000At or below £500k
Cornwall
- Flat / maisonette
- £175,000At or below £500k
- Terraced
- £230,000At or below £500k
- Semi-detached
- £265,000At or below £500k
- Detached
- £404,000At or below £500k
Cardiff
- Flat / maisonette
- £165,000At or below £500k
- Terraced
- £265,000At or below £500k
- Semi-detached
- £310,000At or below £500k
- Detached
- £472,000At or below £500k
The Newcastle question
Newcastle makes the comparison particularly difficult to shrug off. Its detached-house median was £345,475, putting the £500,000 budget about 45% above it. A budget that misses the median flat in one London borough clears every property-type median here. ONS property-type medians
But the second half of Newcastle’s story refuses to follow the first. In the year ending June 2025, an estimated 2,133 moves went from London to Newcastle upon Tyne, while 2,710 went from Newcastle to London. The balance favoured the more expensive destination.
Across the Tyne, Gateshead’s exchange ran the other way. These are separate local authorities, not interchangeable definitions of a single housing market. ONS local-authority matrix
A price comparison cannot tell us what those people wanted. It does tell us that the obvious financial contrast is not sufficient to explain the direction of movement. The question becomes what somebody is paying to remain near, or moving towards, when they accept less building for their money.
London offers one evidence-backed part of an answer. Centre for Cities’ work with Imperial College describes the concentration of knowledge-intensive activity and the value of proximity for sharing information and learning at work. That is an argument about an economic network, not a claim that every London household benefits equally from it. It also does not price the quieter attractions of a familiar street or a relative living nearby. Office politics, 2023
Yes, people leave. Look where they go.
London recorded roughly 420,500 outward moves to other UK regions or countries in the year ending June 2025, substantially more than it received. This is domestic migration, not the capital’s total population change: births, deaths and international migration belong to a different calculation.
Roughly three-fifths of those departures went to the South East or East of England. About one in eight went to the North East, North West or Yorkshire and the Humber. Almost five moves went to the two neighbouring regions for every one that went north. Leaving London often means staying in its part of the country. TRS calculations from ONS regional matrices
London → where?
Outward moves in 2019 and 2025, years ending June. All destinations outside London shown. The North is three regions, not a single city.

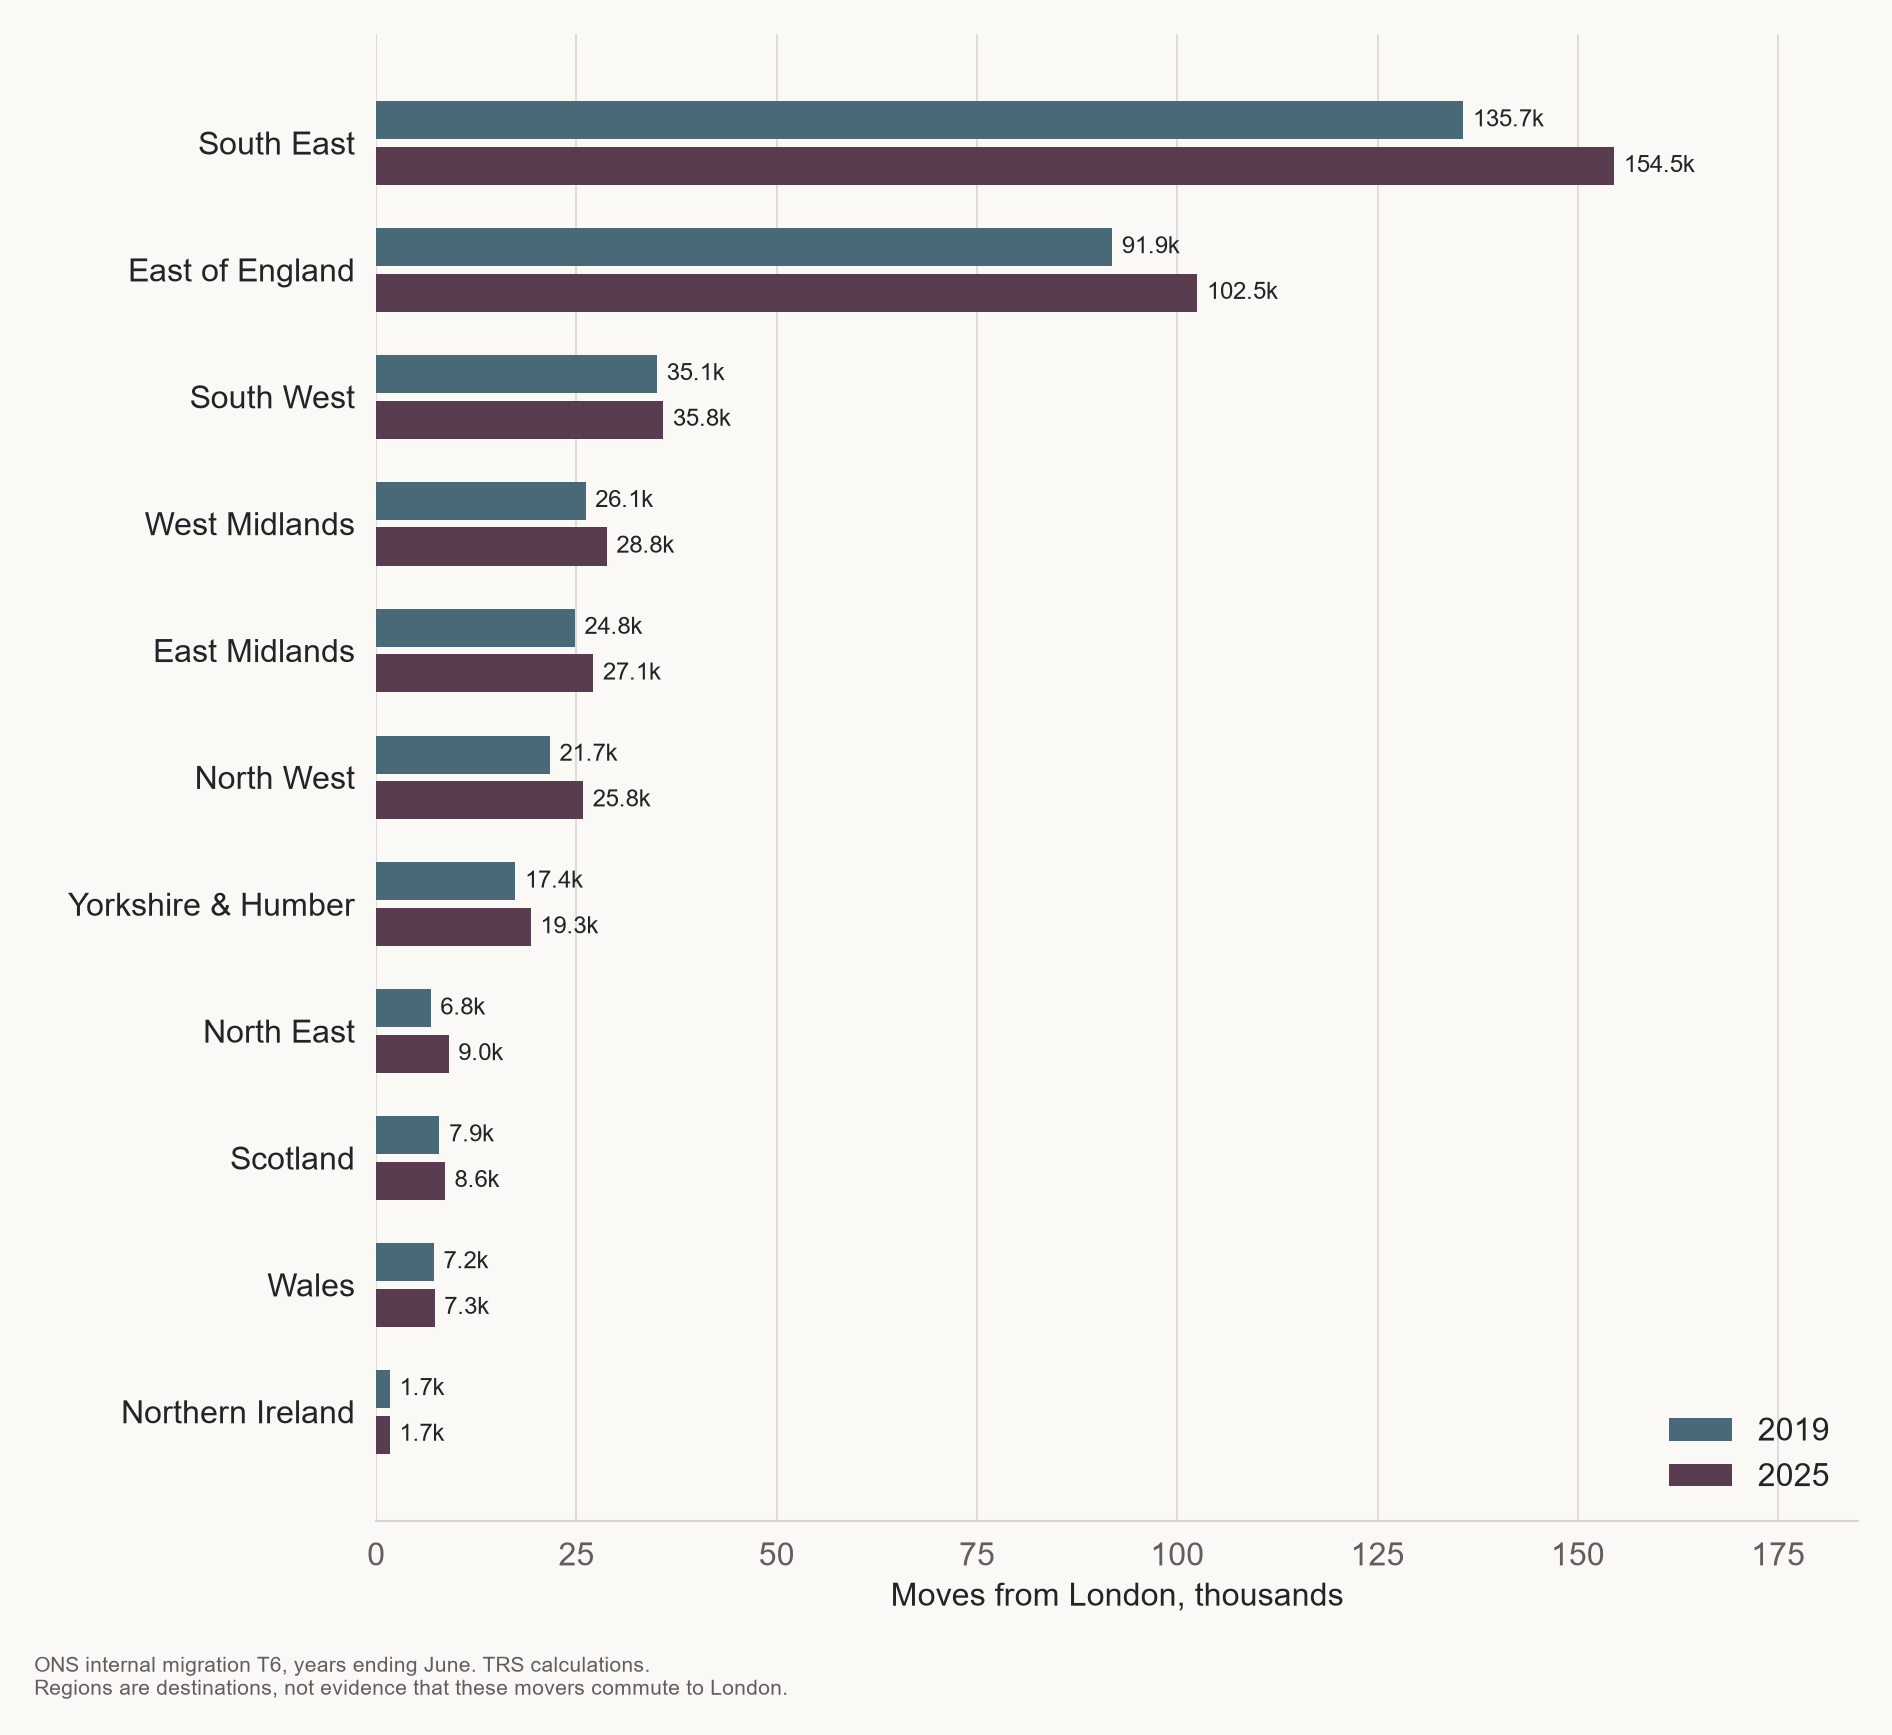
That southern concentration is not new. The proportions were much the same in 2019. The northern share has risen, but the broad geography remains recognisable.
It would be convenient to call every move to the South East or East of England a move to the commuter belt. The regions are much too large for that. Our figures identify destinations, not subsequent workplaces, train journeys or office attendance. They support a story of predominantly southern destinations; they do not, by themselves, prove an enlarged London commuting zone.
A change, rather than a revolution
London-to-North moves averaged about 45,500 a year before the pandemic and about 51,700 in the later period: an increase of 13.6%, comparing 2017–2019 with 2022–2025. Reverse moves also increased. A relocation story needs to keep an eye on the other carriageway.
Northbound moves peaked in 2021, fell the following year and then rose again. By 2025 they remained below that pandemic-period high. The net exchange had nevertheless changed direction: it now favoured the North by about 3,800 moves, whereas it favoured London before the pandemic. There has been a shift. “Everyone is moving north” would be a very poor description of it. ONS regional matrices, rebased and revised series
The northern exchange, 2012–2025
Gross flows above; net exchange below. Positive net values favour the North. The 2020–21 shading marks disruption, not causation.

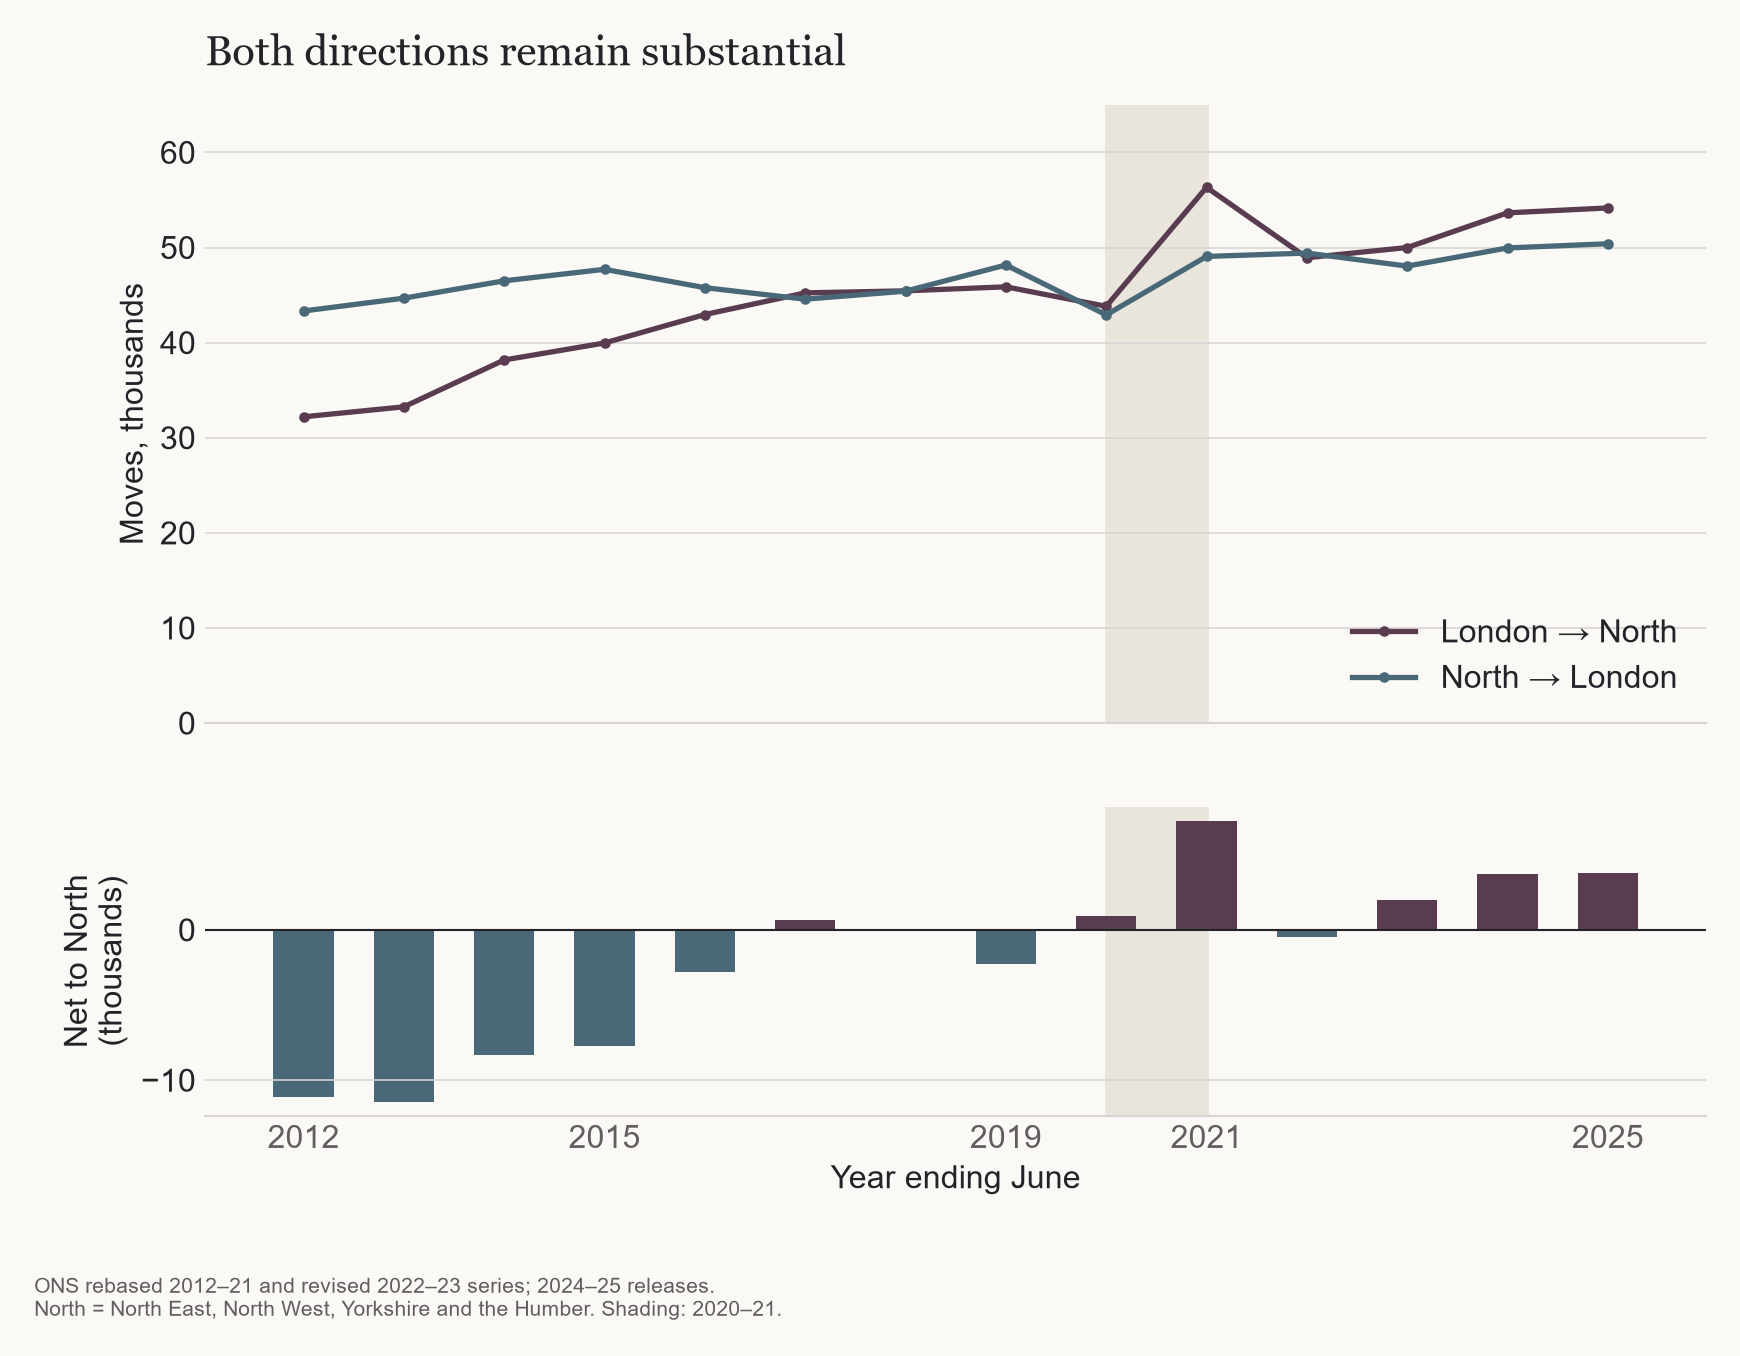
The three northern regions also tell different stories. In 2025, the North West and Yorkshire and the Humber gained in their exchanges with London; the North East still sent slightly more moves the other way. Manchester city itself sent more moves to London than it received, even as the wider North West gained. A region, a city council boundary and a city-region are three different things.
London is not the only southern origin worth examining. The South East and East of England each sent more moves north than they received in return in 2025. Those flows matter, but they cannot be relabelled as Londoners leaving, nor can a move from Norfolk be assumed to resemble one from an inner London borough. Annual regional breakdowns
The direction changes with age
The all-age balance hides a more pronounced exchange. Among people aged 20–24, around 10,800 moves went from London to the North in 2025, against 18,800 in the opposite direction. Ages 25–29 also favoured London.
Across ages 30–49, the balance reversed: about 17,200 went north and 11,700 went to London, a net difference of roughly 5,500.
A different direction in your thirties
London ↔ North by age, year ending June 2025. Broad age patterns are visible; individual motives and working arrangements are not.

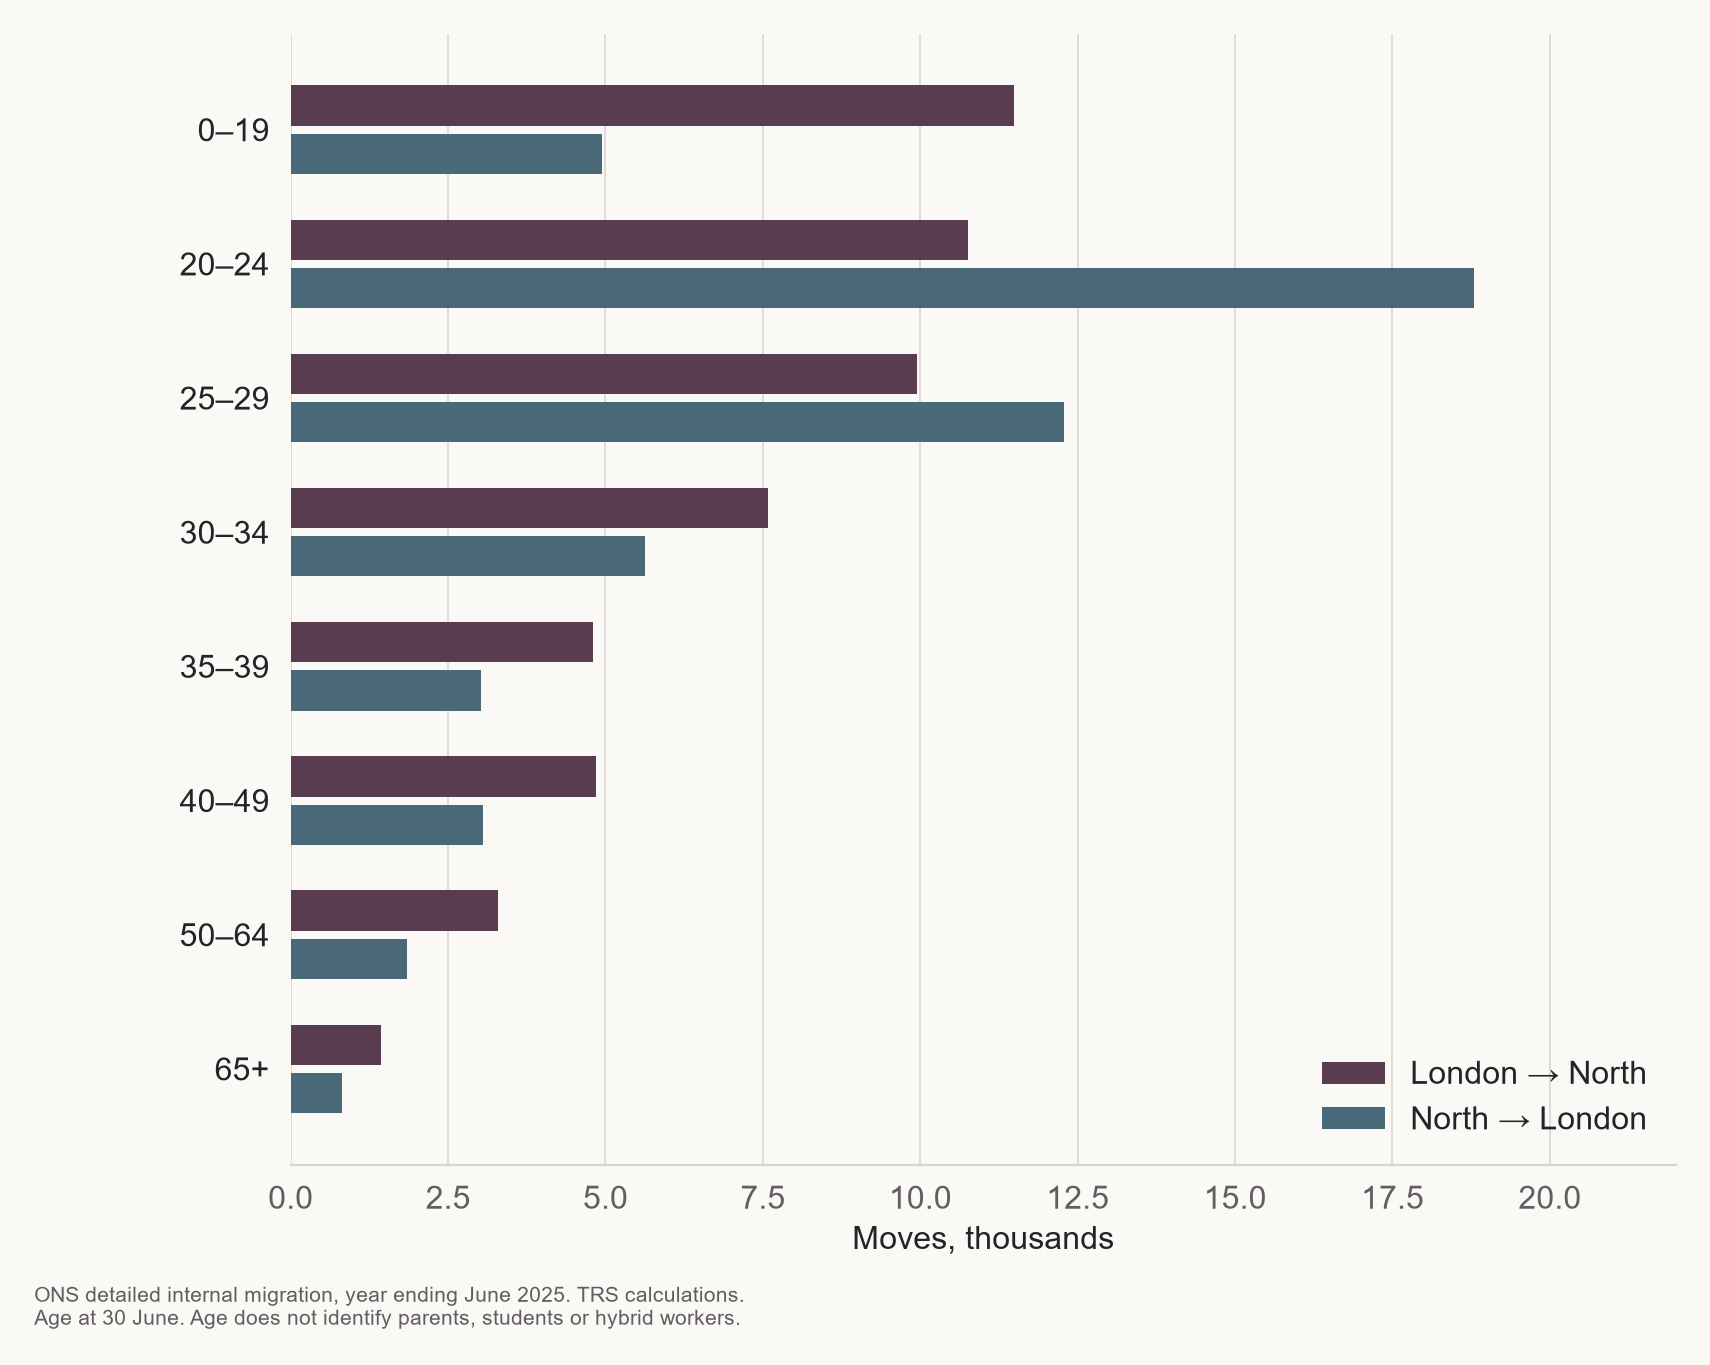
These ages invite a familiar account of careers beginning in one place and domestic priorities changing later. But age is not a biography. We cannot identify graduates, parents, homeowners or hybrid workers in these totals. The separate under-20 and adult flows cannot be joined into invented families. What we can say is that describing a single movement “out of London” misses distinct, simultaneous journeys at different ages. ONS detailed origin–destination estimates, 2025
Work moved, but how far?
Hybrid is an important word here. In the ONS survey covering January to March 2025, 28% of working adults in Great Britain had both worked at home and travelled to work in the previous week. The graphic separates that pattern from home-only and workplace-only working, and from having done neither during the week. Home-only in a survey week is not proof of a permanently remote contract. ONS work-pattern estimates
Flexibility is not evenly distributed
Working patterns in the previous seven days, Great Britain, 8 January–30 March 2025. The fourth category is retained rather than forcing the other three to 100%.

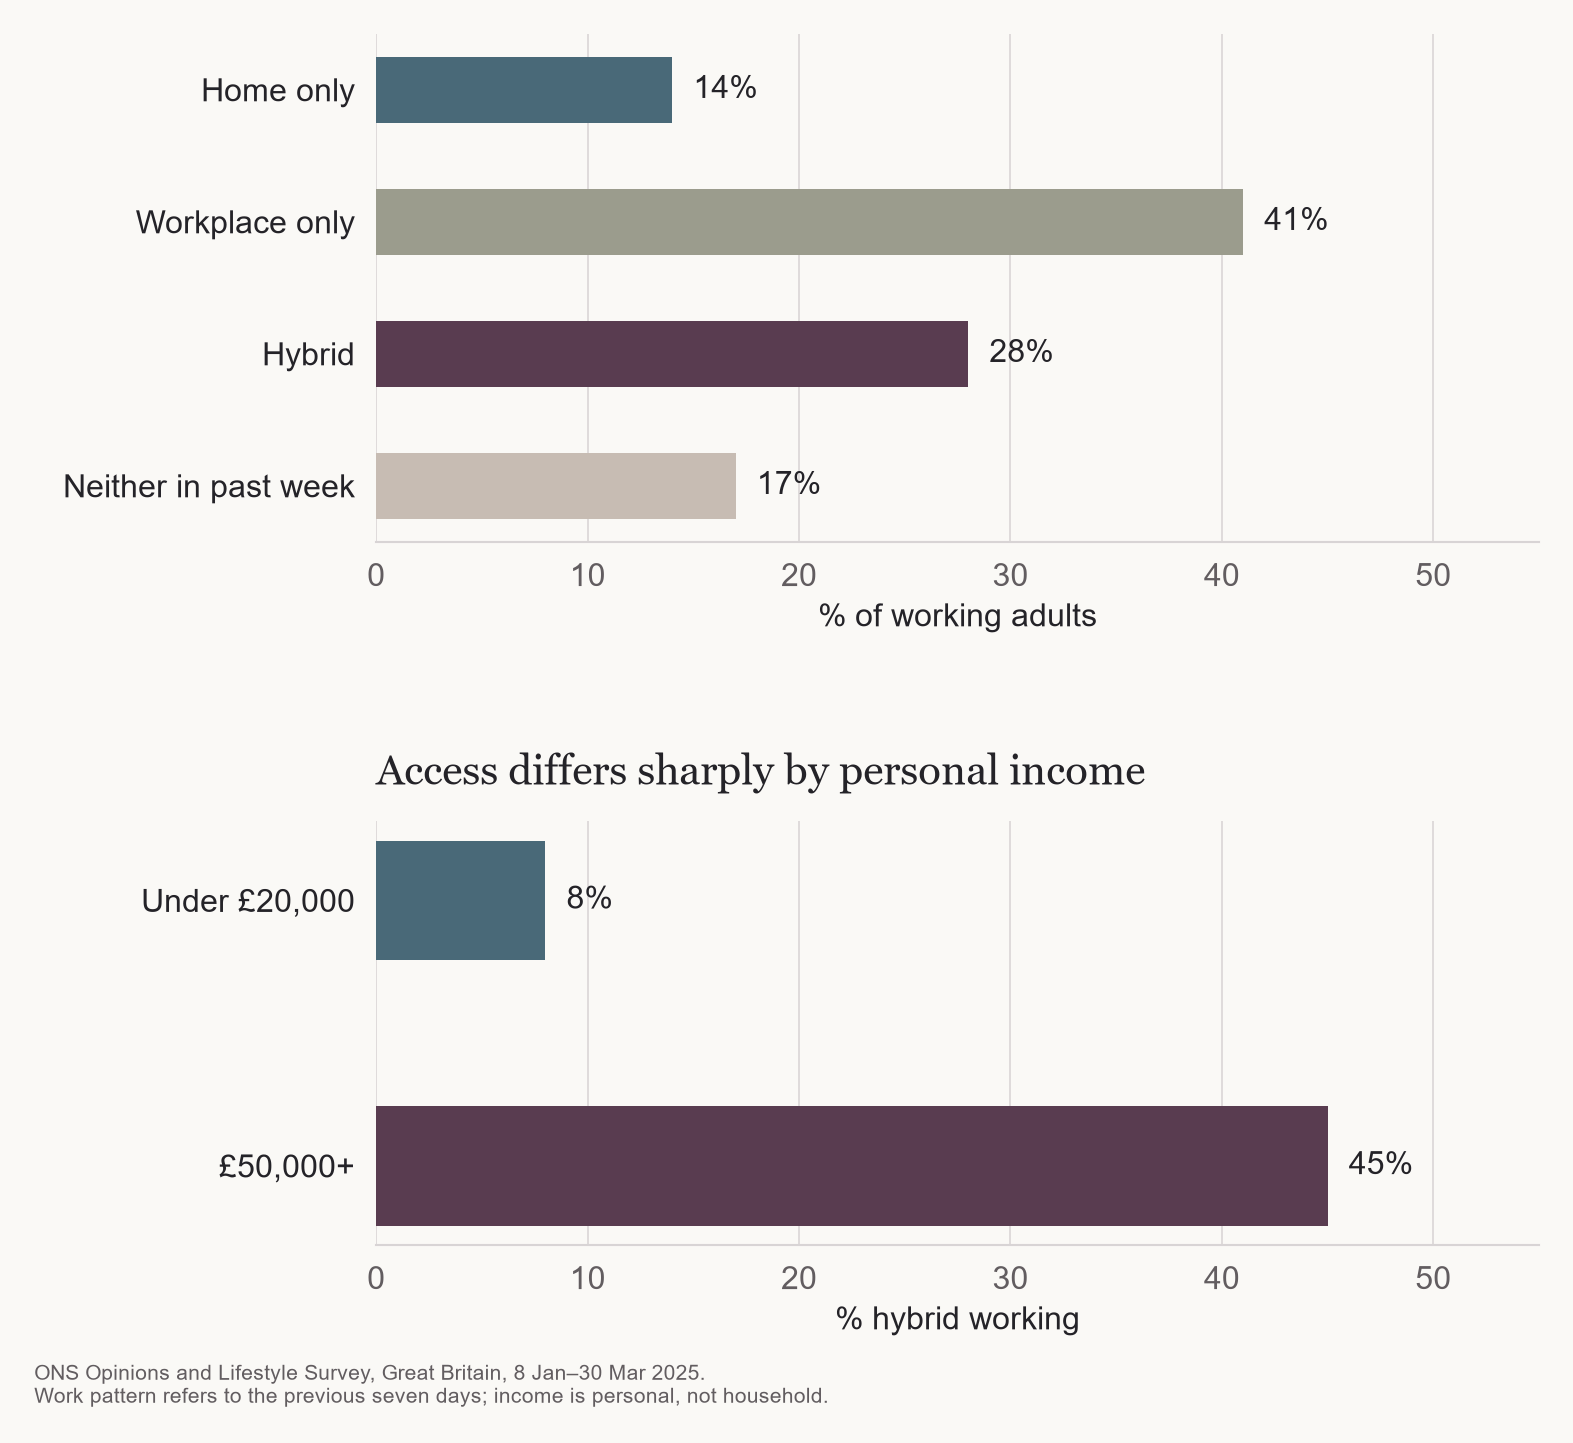
The option is unevenly shared. Hybrid working reached 45% among people with personal annual income of £50,000 or more, against 8% among those below £20,000. The freedom to reconsider an address is itself unevenly distributed.
Hybrid work was also most prevalent among people aged 30–49. That overlaps with the northward age balance, but the two sources do not identify the same people. Combining their percentages would manufacture an explanation. ONS, who has access to hybrid work?
The wider research is more useful than such a shortcut. A 2025 ESRC Centre for Population Change report, using the UK Household Longitudinal Study and city case studies, concluded that homeworking had not radically rearranged the residential mobility of skilled workers. Its qualitative work also describes why transport and local opportunities remain important. That is evidence of constraints, not evidence that nobody has gained freedom. McCollum and colleagues
A 2026 study by Darja Reuschke and Julie MacLeavy makes a helpful distinction between fully remote work and different intensities of hybrid work. It finds an association between fully remote work and inter-regional migration, while office-centred hybrid workers remain much closer to conventional patterns. Its analysis also finds limited coastal revival. These are associations from survey analysis, not a causal estimate of how many moves in our tables were prompted by homeworking. Changing work/places
There is evidence of a more local adjustment too. Morgane Richard’s 2026 working paper uses London property data and a spatial economic model to examine increased demand for space and lower commuting costs. It provides a mechanism through which demand can shift towards suburban homes without requiring a move to another region. A model of that mechanism does not establish that every observed house-price change was caused by remote work. The spatial and distributive implications of working from home
So the useful question is not whether a laptop can travel to Newcastle. It is how often its owner must travel back, and what else has to move with them. A partner’s work, a school place or someone needing care might change the calculation. Those are questions to ask of a household, not motives we can assign to the people in an ONS table.
Cheaper from somewhere else
The coast tests another assumption. Cornwall’s detached-house median was £404,000; Devon’s was £430,000. Both sit below the half-million threshold. But Devon here means the non-metropolitan county, including Exeter and excluding the separate authorities of Plymouth and Torbay. Cornwall is a unitary authority. Neither figure is a price specifically for a home near the sea. ONS property-type medians
Change the question from “What can an incoming budget reach?” to “What do local earnings support?” and the picture changes. In the ONS 2025 residence-based affordability measure, Cornwall’s median house price was about eight times median annual earnings, compared with about six in Newcastle. Brighton and Hove exceeded ten. A lower price looks very different once local earnings are placed beside it. ONS residence-based affordability
A lower price can still be a high local hurdle
Prices and residence-based earnings from the matching ONS 2025 affordability series. Price period: year to September 2025. These are not household-income or mortgage ratios.

Camden
£770,00014.49× annual earningsBrighton and Hove
£415,00010.55× annual earningsWorthing
£350,0009.57× annual earningsBristol, City of
£351,0008.88× annual earningsCornwall
£290,0008.29× annual earningsDevon
£310,0008.60× annual earningsExeter
£300,0008.69× annual earningsManchester
£247,5006.82× annual earningsNewcastle upon Tyne
£208,9215.89× annual earningsBurnley
£130,0003.91× annual earnings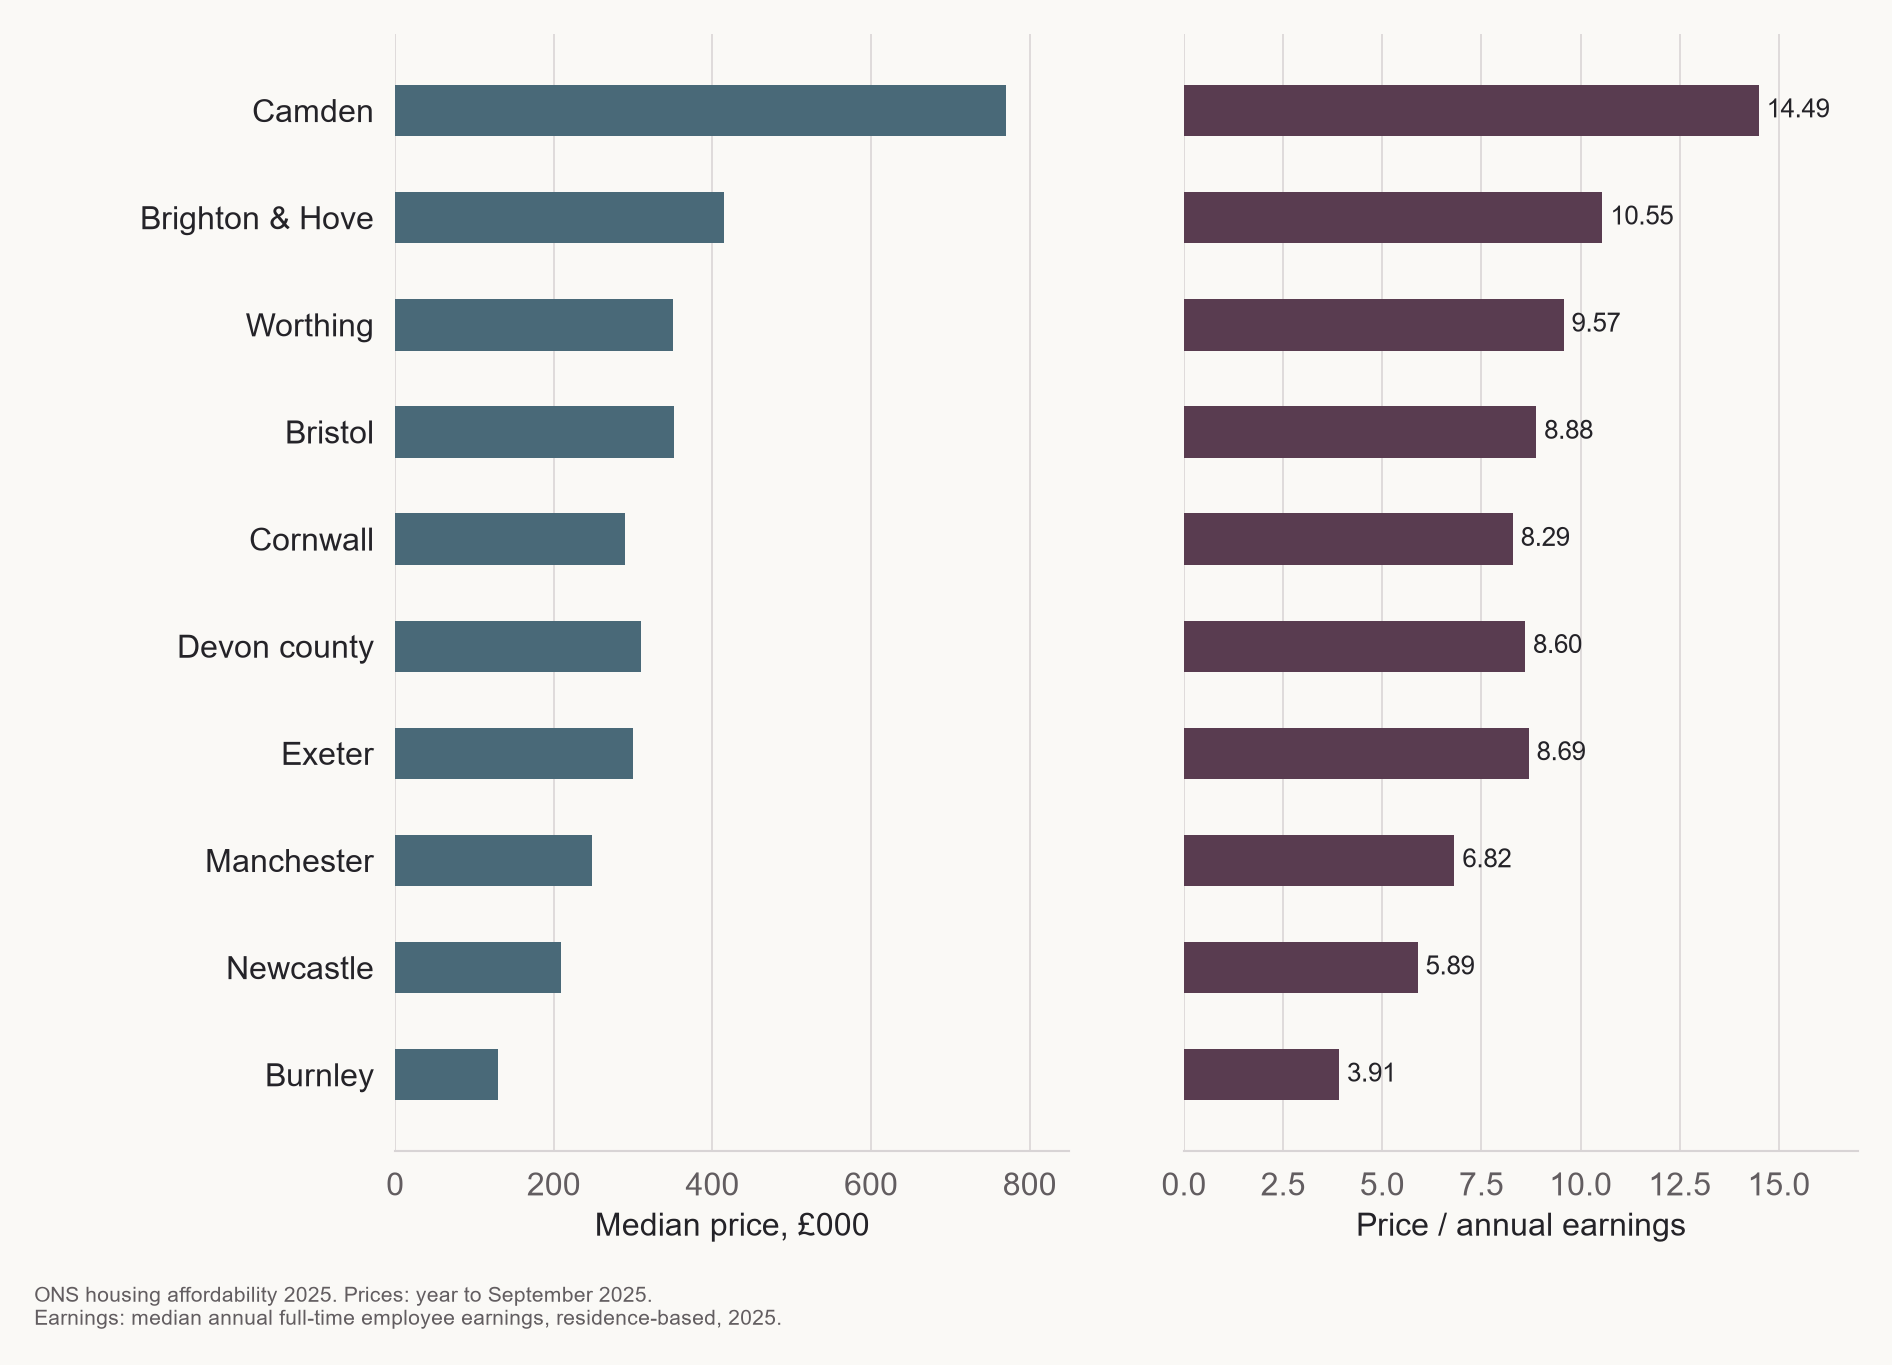
The distinction matters because an incoming buyer’s resources and a resident employee’s earnings are not the same thing. These ratios use individual full-time employee earnings, not household income or a mortgage offer. They cannot establish what caused local prices, or how much pressure came from movers, second homes or any other source. They do stop an attractive comparison for an outsider being mistaken for an affordable market for everybody.

Find the place behind the comparison
The national table includes all 318 local authorities, with sale counts, the four property-type medians and the separate affordability measure. The selected comparisons below bring the geography into focus: London boroughs, regional cities, the coast and two lower-price inland authorities, Burnley and Hyndburn. They are contrasts, not a recommendation list. We selected the inland pair after checking the full dataset, using their low all-property medians and substantial sale volumes.
Compare 25 selected places, including Devon county
Property medians: year to March 2026. Affordability: ONS 2025, using prices to September. Counts accompany every price.
| Area | Detached | Semi-detached | Terraced | Flat / maisonette | £500k position | Affordability |
|---|---|---|---|---|---|---|
| CamdenLondon | £4,047,50026 sales | £2,830,00060 sales | £1,733,750184 sales | £695,0001183 sales | No robust type median at/below budget | 14.49×Residence-based |
| HackneyLondon | £930,0007 sales · low volume | £1,507,50028 sales | £1,250,000309 sales | £530,0001309 sales | No robust type median at/below budget | 11.72×Residence-based |
| CroydonLondon | £725,000400 sales | £547,000710 sales | £435,0001008 sales | £280,0001091 sales | Terraced, Flat / maisonette | 9.59×Residence-based |
| Barking and DagenhamLondon | £460,00013 sales · low volume | £441,250128 sales | £400,000684 sales | £235,000246 sales | Semi-detached, Terraced, Flat / maisonette | 9.77×Residence-based |
| Brighton and HoveSouth East | £725,000342 sales | £500,000536 sales | £500,000810 sales | £297,5001321 sales | Semi-detached, Terraced, Flat / maisonette | 10.55×Residence-based |
| WorthingSouth East | £550,000286 sales | £395,000312 sales | £350,000311 sales | £215,000494 sales | Semi-detached, Terraced, Flat / maisonette | 9.57×Residence-based |
| Bristol, City ofSouth West | £550,000266 sales | £370,0001133 sales | £375,0002209 sales | £258,0001607 sales | Semi-detached, Terraced, Flat / maisonette | 8.88×Residence-based |
| BirminghamWest Midlands | £450,000910 sales | £260,0002900 sales | £217,5002825 sales | £146,0001389 sales | Detached, Semi-detached, Terraced, Flat / maisonette | 6.53×Residence-based |
| ManchesterNorth West | £386,000171 sales | £302,5001213 sales | £250,0001220 sales | £211,0001569 sales | Detached, Semi-detached, Terraced, Flat / maisonette | 6.82×Residence-based |
| LiverpoolNorth West | £376,000307 sales | £240,0001140 sales | £160,0001777 sales | £150,000799 sales | Detached, Semi-detached, Terraced, Flat / maisonette | 4.85×Residence-based |
| LeedsYorkshire and The Humber | £425,0001568 sales | £260,0003450 sales | £197,2502512 sales | £150,0001133 sales | Detached, Semi-detached, Terraced, Flat / maisonette | 6.67×Residence-based |
| SheffieldYorkshire and The Humber | £375,000826 sales | £220,0002081 sales | £191,0001799 sales | £140,000750 sales | Detached, Semi-detached, Terraced, Flat / maisonette | 5.75×Residence-based |
| Newcastle upon TyneNorth East | £345,475406 sales | £215,000936 sales | £185,000951 sales | £150,000675 sales | Detached, Semi-detached, Terraced, Flat / maisonette | 5.89×Residence-based |
| NottinghamEast Midlands | £300,000429 sales | £217,000829 sales | £177,500925 sales | £138,000318 sales | Detached, Semi-detached, Terraced, Flat / maisonette | 6.49×Residence-based |
| NorwichEast | £380,000193 sales | £260,000262 sales | £240,000714 sales | £149,000430 sales | Detached, Semi-detached, Terraced, Flat / maisonette | 6.66×Residence-based |
| CardiffWales | £472,000652 sales | £310,0001048 sales | £265,0001592 sales | £165,000889 sales | Detached, Semi-detached, Terraced, Flat / maisonette | 7.2×Residence-based |
| OxfordSouth East | £800,500115 sales | £490,000362 sales | £465,000389 sales | £323,750296 sales | Semi-detached, Terraced, Flat / maisonette | 10.4×Residence-based |
| CambridgeEast | £803,748124 sales | £562,500234 sales | £500,000436 sales | £325,000282 sales | Terraced, Flat / maisonette | 11.32×Residence-based |
| CornwallSouth West | £404,0002653 sales | £265,0001608 sales | £230,0002109 sales | £175,000779 sales | Detached, Semi-detached, Terraced, Flat / maisonette | 8.29×Residence-based |
| DevonCounty, includes Exeter | £430,0003892 sales | £295,0002385 sales | £245,0003291 sales | £168,0001275 sales | Detached, Semi-detached, Terraced, Flat / maisonette | 8.6×Residence-based |
| ExeterSouth West | £450,000262 sales | £332,500344 sales | £275,000564 sales | £176,500252 sales | Detached, Semi-detached, Terraced, Flat / maisonette | 8.69×Residence-based |
| PlymouthSouth West | £390,000362 sales | £260,000919 sales | £210,0001448 sales | £135,000649 sales | Detached, Semi-detached, Terraced, Flat / maisonette | 6.39×Residence-based |
| TorbaySouth West | £388,000406 sales | £269,000422 sales | £220,000503 sales | £147,000453 sales | Detached, Semi-detached, Terraced, Flat / maisonette | 7.46×Residence-based |
| BurnleyNorth West | £292,750182 sales | £177,000296 sales | £96,000663 sales | £88,62542 sales | Detached, Semi-detached, Terraced, Flat / maisonette | 3.91×Residence-based |
| HyndburnNorth West | £265,000123 sales | £185,000296 sales | £110,000585 sales | £81,50018 sales · low volume | Detached, Semi-detached, Terraced | 3.86×Residence-based |
Find your area
All 318 local authorities in England and Wales. £500k position lists types whose median is at or below the budget and has at least 20 recorded sales.
Download all 318 areas (CSV) · Prices: year ending March 2026. Affordability: 2025, price year ending September. Low sales counts need caution. The £500k benchmark excludes transaction costs.
What are we paying to stay?
The most useful thing about the £500,000 comparison may be the question it leaves unanswered. It can show how far a sum of money sits above or below a local median. It cannot decide whether a larger home would make a particular life better. Nor can it value the ease of an ordinary Tuesday in a place someone knows.
The movement is real: more London-to-North moves than before the pandemic, a modest recent net gain for the North, and a much stronger distinction once we look at age. Yet most London departures still lead to the South East or East of England. Work has become more flexible for some people without making the map irrelevant.
There is no obligation to choose the largest building a budget might reach. There is, perhaps, a reason to be more deliberate about the exchange. Which part of the price pays for space? Which part pays for access? And which part keeps us close to the people and places that make the space worth coming home to?